The Southeast Asian market has largely eluded U.S. soy products due to the presence of Argentina and Brazil in the region, but that could change with a free trade agreement (FTA) between the United States and the Association of Southeast Asian Nations (ASEAN), a group of Southeast Asian countries that works to benefit each of its members through community and free trade. The ten member countries have few or no tariffs on trade among themselves and make up what is referred to as the ASEAN Free Trade Area (AFTA). ASEAN members can also negotiate with outside countries to establish individual FTAs, such as the 2004 FTA between the United States and Singapore that eliminated tariffs on all U.S. exports to Singapore (USTR, 2003).
The United States have existing instances of market access to countries within ASEAN, such as the Philippines and Singapore. An FTA agreement with the region as a whole would help facilitate more trade and a stable relationship between the United States and ASEAN. An agreement to eliminate tariffs on U.S. goods traded with ASEAN would grant more market access for the U.S. soybean industry and increase whole bean and meal exports when U.S. soy becomes more affordable. Open market access for U.S. soybean meal is beneficial when considering the increase in demand for feed inputs for the expanding pork and poultry industries in ASEAN countries such as the Philippines and Vietnam (Lee and Hansen, 2019). ASEAN imported 38.5% of total soybean meal imports from Argentina, 41.5% from Brazil, and only 13.5% from the United States in the 2022/2023 marketing year (Trade Data Monitor, 2023). Given the supply volatility and export taxes on soybean meal and oil in Argentina, there is potential U.S. soybean meal to displace Argentina soybean products in ASEAN, which presents an excellent opportunity for the expanding U.S. soybean industry.
U.S. soy product exports to ASEAN currently face tariff and nontariff barriers that prevent the United States from exporting more agricultural products to Southeast Asian countries. Some ASEAN countries, such as Brunei, have agriculture tariffs as low as 0%, while others, such as Vietnam, have tariffs as high as 16.5% (USTR, 2022). As of 2015, 5,975 nontariff measures (NTMs) restrict U.S. exports to ASEAN countries (UNCTAD, 2016).
ASEAN has numerous FTAs with other countries, including Australia, New Zealand, China, India, Japan, the Republic of Korea, and Hong Kong (ASEAN, 2020). A common denominator among all these agreements is the gradual elimination of tariffs and nontariff measures, including licensing requirements, quantity restrictions, technical barriers to trade, and sanitary and phytosanitary measures (ASEAN, 2020). The United States has FTAs with 20 countries, all with the goal of limiting the impacts of nontariff measures (USTR, N.D.b). One of the most recent and significant trade agreements the United States has negotiated is the United Stares–Mexico–Canada Agreement (USMCA), which has language very similar to the ASEAN–Australia–New Zealand FTA in regard to sanitary and phytosanitary measures. Both of these agreements have goals to protect life and health and increase transparency while eliminating trade barriers (USTR, N.D.b). Using past FTAs that both countries are currently a part of will provide a template for a potential FTA between the United States and ASEAN.
This paper discusses the export potential for U.S. soybean products to ASEAN under the terms of a potential FTA. We consider how significant soybean competitors’ products in the world market, such as Argentina and Brazil, will affect the supply of whole soybeans and the demand for soybean meal from the United States by ASEAN. We use an existing FTA between the United States and ASEAN member Singapore to compare and discuss how a comprehensive FTA might operate between the United States and ASEAN.
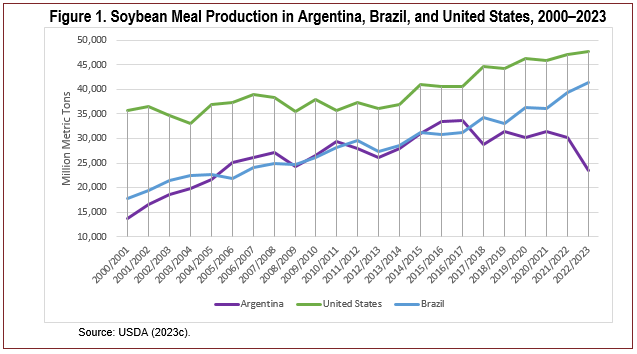
Brazil began increasing soybean production in 2012/2013 to meet import demand in China and overtook the United States as the largest producer of soybeans in the 2017/2018 marketing year (USDA, 2023c). Argentina is the world’s third largest soybean producer but produces a fraction of what the United States and Brazil produce. However, Argentina crushed a larger portion of soybean production and was the world’s top exporter of soybean meal except in 2023, when the country experienced extensive drought.
The government in Argentina previously encouraged soybean meal and oil exports through a differential export tax, which historically included higher export taxes on whole beans but lower export taxes on meal and oil. Argentina’s government changed the tax rates on exports in 2020, which resulted in soybean meal and oil being taxed an additional 3% (United Soybean Board,2020). The other export taxes led to lower crush margins and production, which decreased meal and oil exports from Argentina. Due to economic crises in Argentina, a bill was proposed to raise export taxes on soybean meal and oil from 30% to 33%, which could potentially decrease exports (Boroughs, 2020).
Along with increased export taxes, Argentina faced a drought that heavily affected the 2022/2023 soybeancrop. Production is estimated to be 23.4 million metric tons (MMT) in 2022/2023, the lowest production in Argentina in 24 years (USDA, 2023a). Due to its small soybean crop, Argentina had to increase whole bean imports to satisfy domestic crush demand and decreased soybean meal exports by 21.10 MMT (USDA, 2023a). The United States produces more soybean meal than both Argentina and Brazil (Figure 1). The U.S. domestic animal feed industry consumes 74% of soybean meal (USDA, 2023c). However, U.S. soybean meal production increased by 33% from 2000/2001 to 2022/2023, and this upward trend will continue due to increased domestic crushing capacity (USDA, 2023c). An increase in soybean meal supply in the United States allows a larger portion of soybean meal to be exported to ASEAN.
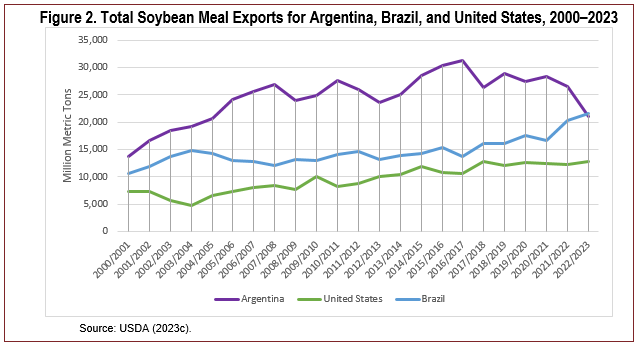
Between the new export taxes and decreased production in Argentina, exports have dropped 26.77% since the 2019/2020 marketing year (USDA,2023c). Meal exports from Brazil and the United States increased by 7.14% and 3.52%, respectively, in the 2022/2023 marketing year to compensate for the decrease in exports from Argentina. The recent increase in meal exports resulted in Brazil barely passing Argentina as the world’s largest exporter of soybean meal in the 2022/2023 marketing year (Figure 2).The United States is primarily a whole soybean exporter. Over the last three complete marketing years (2019/2020–2021/2022), an average of 50% of U.S. soybean production was exported as whole soybeans, while 11% was exported as soybean meal and 1% wasexported as soybean oil (USDA, 2023c). The rise of renewable diesel can shift some of these historical patterns. Biofuel has seen tremendous growth in the United States and worldwide, with more expected (Troderman and Shi, 2023). Soybean oil will likely be a primary feedstock for the growing demand for biofuel (Gerlt, 2022).
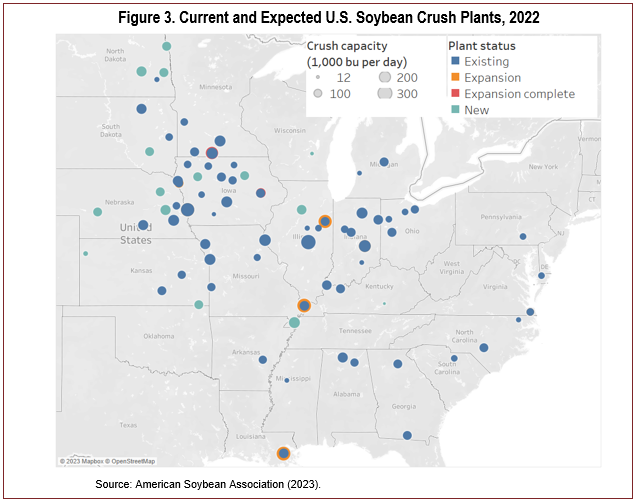
The U.S. soybean crush industry is expanding to provide the soybean oil needed for the oncoming renewable diesel plants (Figure 3). More than 22 announcements for new or expanding crush facilities have been announced in response, which would increase domestic crushing capacity from a little over 2.2 billion bushels of practical capacity per year before the start of the announcements to about 2.8 billion bushels per year if all the plants are built over the next several years (excluding the Cargill plant in Southeast Missouri, which has been put on hold) (American Soybean Association, 2023). The USDA’s projected soybean meal yields for 2023/2024 bring practical soybean meal capacity from 57 MMT before the rise of renewable diesel to a potential of 74 MMT (USDA, 2023a).
The increase in domestic crush capacity will be met with increased domestic soybean production through yield growth, acreage changes, and exports. While the increased quantities of soybean oil are destined for the biofuel market, the additional soybean meal will find domestic and foreign consumers. The properties of soybean meal make it more challenging to handle infacilities than soybeans, which can be a challenge for exporting soybean meal (Dry Cargo International, 2013). The soybean industry announced investments to increase the ability to export soybean meal from thePacific Northwest by increasing shipping and storage capacity at the Port of Grays Harbor (Dunlap, 2022).
Given the increased number of crushing plants in the Northern Plains, the region is well suited to export soybean meal through the Pacific Northwest to Asian markets. A major transportation method for soybean meal is the railway system, and BNSF Railway is the Class I Carrier for the Northern Plains with lines into the Pacific Northwest. BNSF completed the Sandpoint Bridge project in Idaho in 2023 to help decrease congestion and provide a more efficient rail system to transport agricultural commodities, such as soy products, through the Pacific Northwest region (BNSF Railway, 2023b). The changing structure of the soybean products market in the United States in the near future provides an excellent opportunity to meet growing demand in ASEAN.
ASEAN has been one of the fastest-growing regions in the last decade, with no signs of slowing growth, given a projected annual real GDP growth rate of 4.6% from 2023 to 2032 (USDA, 2023b). Cambodia and Vietnam make the largest contribution to this relatively large GDP growth, both with expected annual real GDP growth of more than 6% over the next decade (USDA, 2023b) , and every other ASEAN country has expected annual real GDP growth of at least 2%.
GDP growth is often paired with increased demand for proteins due to increased purchasing power (Whitton et al., 2021). The most common type of proteins consumed in Southeast Asia are pork and poultry, both of which use soybean meal as inputs. In Southeast Asia, porkconsumption is projected to increase 21.4% from 2023
to 2032 (USDA, 2023b). In Vietnam, the government controls pork prices closely because of its importance in consumer diets and to protect local meat producers (Euromonitor International, 2022). Vietnam is among the top 10 pork producers in the world and is the second largest producer of pork in Asia, only behind China (Lee and Hansen, 2019). Thailand is the fourth largest poultry producer and is estimated to increase exports by 59% by 2028 due to plans to improve facilities (Lee and Hansen, 2019). Over the last decade, pork and poultry production increased by 14% and 41%, respectively (USDA, 2023c). Pork and poultry production has increased almost yearly in ASEAN, excluding years of substantial disease outbreaks such as African Swine Fever in 2019 and 2020. While ASEAN already produces large amounts of proteins, meat production is expected to increase by 2.4% annually through 2028 (USDA, 2019).
The aquaculture industry in ASEAN is also growing to satisfy the increased demand for protein in the region. Because of its high protein content, soybean meal is a major feed input for aquaculture (United Soybean Board, 2019). Indonesia and Vietnam are among the top aquaculture producers in the world: Indonesia’saquaculture feed consumption demand is projected to be5.8 MMT in 2023/2024 (Rahmanulloh, 2023). Production in Vietnam was 5.16 million tons in 2022 (Linh, 2023).
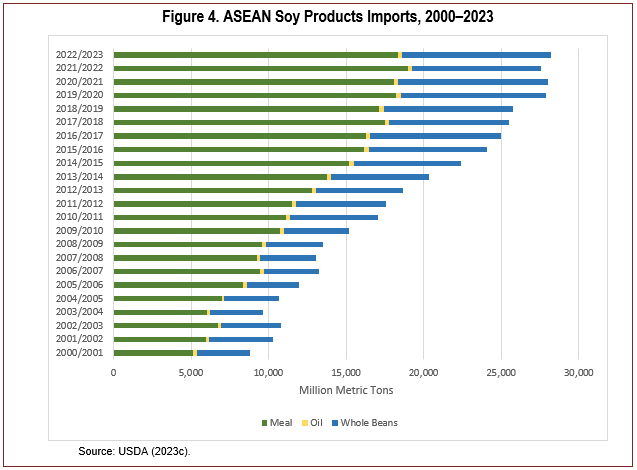
ASEAN countries produce large quantities of pork and poultry to satisfy domestic demand, but they cannot grow and crush enough soybeans to meet the demand for protein feed requirements. The USDA projects that Southeast Asia will account for 42.3% of world soybean meal imports by 2032/33 (USDA, 2023b). ASEAN lacks crushing capacity, necessitating higher import demand for soybean meal than whole soybeans. One reason for the lack of soybean crush in this region is their use of palm oil negates the need for soybean oil. Figure 4 shows that soybean meal is the largest portion of soy product imports in ASEAN. Some of the larger pork and poultry producers in ASEAN—including Indonesia,Vietnam, and the Philippines—are expected to increase imports of soybean meal from 14.4 MMT in 2023/2024 to 17.3 MMT in 2032/33 (USDA, 2023b). By 2028, ASEAN will account for one-third of global soybean meal imports (Lee and Hansen, 2019).
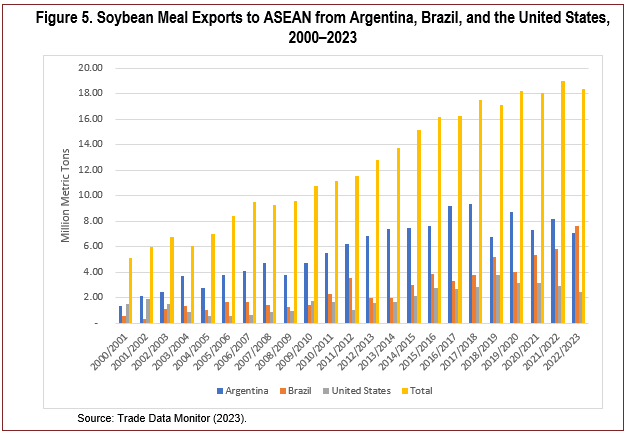
In the 2022/2023 marketing year, ASEAN imported 18.3 MMT of soybean meal. Argentina, Brazil, and the United States comprised 93.5% of the total soybean meal imported into ASEAN. Figure 5 illustrates the breakdown of soybean meal imports by country and the total number of imports into ASEAN. Brazil represented the highest portion of imports at 41.5%, Argentina at 38.5%, and the United States at 13.5% (USDA,2023c). Only 6.5% of soybean meal imports did not come from the top three soybean meal exporters.
Rising demand for soybean products, specifically soybean meal, in ASEAN, paired with a decrease in supply from Argentina, provides an opportunity for the United States to increase soybean meal exports to ASEAN. There is also potential for Brazil to become the top exporter of soybean meal to ASEAN. While Brazilcould have an advantage over the United States because of its relatively cheaper soybean meal prices, neither the United States nor Brazil has an FTA with ASEAN. If the United States were to establish an FTA with ASEAN, soy products exported to ASEAN would be more affordable with increased market access.
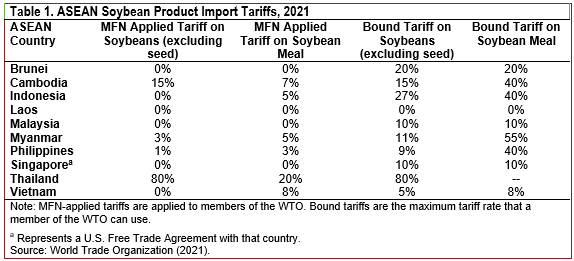
Table 1 shows ASEAN import tariff rates for soybean meal and whole soybeans (World Trade Organization, 2021). Most favored nation (MFN) tariffs are applied to countries that are World Trade Organization (WTO) members. Argentina, Brazil, the United States, and ASEAN countries are members of the WTO and fall under the MFN category. Bound tariffs are agreed upon when a country becomes a member of the WTO and represent the maximum tariff rate that can be applied to other members. Bound tariffs typically provide countries with leeway when adjusting trade policy. Countries with a large gap between MFN rates and bound rates tend to be developing countries, which often have unpredictable trade policies (World Bank, 2010).
MFN tariff rates for soybeans range from 0% to 80%, while MFN tariff rates for soybean meal in ASEAN range from 0% to 20%. Thailand imposes the highest MFN import tariffs on soybeans and soybean meal (80% and 20%), followed by Cambodia (15% and 7%). The boundtariff rates for soybean meal are 55% in Myanmar, 40% in the Philippines, 40% in Cambodia, and 40% inIndonesia, which are much higher than MFN rates. Thisrepresents the potential for countries to increase levels without an FTA that goes beyond WTO commitments. Since Argentina, Brazil, and the United States are MFN countries and none have an FTA with ASEAN, each country faces the same tariffs when exporting soybean products to ASEAN. While the United States does not have an FTA with ASEAN, the UnitedStates and Singapore established an FTA in 2004. This agreement eliminated tariffs on exported and importedagricultural goods between the United States and Singapore. A similar deal with ASEAN that eliminates tariffs would place U.S. soybean products at a price advantage relative to Argentina and Brazil.
The Brazilian crush outperformed expectations in the 2022/2023 marketing year, resulting in excess supply and decreased prices for Brazilian soybean meal in the global market. Accordingly, Brazil could supply soybean meal at a discount compared to Argentina and theUnited States (Kingsbury, 2023). The Brazilian real is also going through a revaluation period, pushing commodity prices down and making Brazilian exportsrelatively cheaper (Degreenia, 2023). Establishing an FTA between the United States and ASEAN would remove tariffs for the United States and close the price gap on the world market, making U.S. soybean meal more affordable.
ASEAN has been growing faster than many other regions worldwide and will continue to grow in the foreseeable future. Incomes in the region grow in tandem with increased demand for animal protein. ASEAN has strong and growing pork and poultry production but relies on soybean meal imports for feed. Accordingly, ASEAN must increase soybean meal imports to meet the needs of expanded domestic pork and poultry production. Growing soybean meal import demand in ASEAN, increased soybean meal supply in the United States and policy uncertainty in Argentina presents an opportunity for the United States to export more soybean products to ASEAN. Given the importance of price for competitiveness in the global soybean meal market, a free trade agreement between the United States and ASEAN that eliminates import tariffs on U.S. soybean products is needed for the United States to compete with Brazil in this critical region.
American Soybean Association. 2023. Internal report using data from G. Denny.
Association of Southeast Asian Nations (ASEAN). 2020. “Free Trade Agreements with Dialogue Partners.” ASEAN. Available online: https://asean.org/free-trade-agreements-with-dialogue-partners/
BNSF Railway. 2023a, July. “BNSF Railway.” BNSF Railway. Available online: https://www.bnsf.com/bnsf-resources/pdf/about-bnsf/fact_sheet.pdf
BNSF Railway. 2023b, September 14. “BNSF Ready for Fall: From Harvest to Market.” Rail Talk. BNSF Railway. Available online: https://www.bnsf.com/news-media/railtalk/service/fall-harvest-23.html
Boroughs, B. 2020, March 5. New Export Tax Rates in Argentina. USDA Foreign Agricultural Service, GAIN Report AR2020-0008. Available online: https://apps.fas.usda.gov/newgainapi/api/Report/DownloadReportByFileName?fileName=New Export Tax Rates in Argentina_Buenos Aires_Argentina_03-02-2020
Degreenia, J. 2023, April 25. Brazil: Oilseeds and Products Annual. USDA Foreign Agricultural Service. GAIN Report BR2023-0007. Available online: https://apps.fas.usda.gov/newgainapi/api/Report/DownloadReportByFileName?fileName=Oilseeds and Products Annual_Brasilia_Brazil_BR2023-0007.pdf
Dry Cargo International. 2013, July 18. “Bulk Knowledge: Soybean Meal Handling.” Available online: https://www.drycargomag.com/bulk-knowledge-soybean-meal-handling
Dunlap, K. 2022, March 22. “AGP Approves Export Facility Expansion at Port of Grays Harbor on Washington’s Pacific Coast.” Port of Grays Harbor. Available online: https://www.portofgraysharbor.com/news/agpexpansion
Euromonitor International. 2022, December. “Meat in Vietnam – Analysis.” Country Report.
Gerlt, S. 2022, November 10. “Soybean Processing Growth is Crushing It.” Economist’s Angle. American Soybean Association. Available online:
https://soygrowers.com/news-releases/economists-angle-soybean-processing-growth-is-crushing-it/
Kingsbury, A. 2023, June 9. Oilseeds: World Markets and Trade. USDA Foreign Agriculture Service, Global Market Analysis Circular. Available online: https://apps.fas.usda.gov/PSDOnline/CircularDownloader.ashx?year=2023&month=06&commodity=Oilseeds
Lee, T., and J. Hansen. 2019, April 1. “Southeast Asia’s Growing Meat Demand and Its Implications for Feedstuffs Imports.” Amber Waves. USDA Economic Research Service. Available online: https://www.ers.usda.gov/amber-waves/2019/april/southeast-asia-s-growing-meat-demand-and-its-implications-for-feedstuffs-imports/
Linh, N., 2023, April 3. Vietnam: Oilseeds and Products Annual. USDA Foreign Agricultural Service. GAIN Report VM2023-0015. Available online:
https://apps.fas.usda.gov/newgainapi/api/Report/DownloadReportByFileName?fileName=Oilseeds and Products Annual_Hanoi_Vietnam_VM2023-0015.pdf
Rahmanulloh, A., 2023 March 20. Indonesia: Oilseeds and Products Annual. USDA Foreign Agricultural Service. GAIN Report ID2023-0005. Available online: https://apps.fas.usda.gov/newgainapi/api/Report/DownloadReportByFileName?fileName=Oilseeds and Products Annual_Jakarta_Indonesia_ID2023-0005.pdf
Trade Data Monitor. 2023. Trade Data Monitor Database. Available online: https://www1.tdmlogin.com/tdm/index.html
Troderman, J., and E. Shi. 2023, February 6. “Domestic Renewable Diesel Capacity Could More Than Double Through 2025.” Today in Energy. U.S. Energy Information Administration. Available online: https://www.eia.gov/todayinenergy/detail.php?id=55399
United Nations Conference on Trade and Development (UNCTAD). 2016. Non-Tariff Measures in ASEAN. Economic Research Institute for ASEAN and East Asia. Available online: https://unctad.org/system/files/official-document/ERIA-UNCTAD_Non-Tariff_Measures_in_ASEAN_en.pdf
United Soybean Board. 2019, February 26. “U.S. Soy Sees Potential in Aquaculture.” The Soy Hopper. Available online: https://www.unitedsoybean.org/hopper/us-soy-sees-potential-in-aquaculture/
———. 2020, October. Country Focus: Argentina. Market View Insight 20-7. Available online: https://marketviewdb.unitedsoybean.org/insights/?mvi=CountryFocusArgentina
U.S. Department of Agriculture. 2019, March. USDA Agricultural Projections to 2028. Long-term Projections Report OCE-2019-1. USDA Office of the Chief Economist, World Agricultural Outlook Board, Interagency Agricultural Projections Committee. Available online: https://www.ers.usda.gov/webdocs/outlooks/92600/oce-2019-1.pdf?v=8312.9
———. 2023a, June 9. World Agricultural Supply and Demand Estimates. USDA Office of the Chief Economist, Agricultural Marketing Service, Farm Service Agency, Economic Research Service, Foreign Agricultural Service, World Agricultural Outlook Board. Available online: https://www.usda.gov/oce/commodity/wasde/wasde0623.pdf
———. 2023b, February. USDA Agricultural Projections to 2032. Long-term Projections Report OCE-2023-1. USDA Office of the Chief Economist, World Agricultural Outlook Board, Interagency Agricultural Projections Committee.Available online: https://www.usda.gov/sites/default/files/documents/USDA-Agricultural-Projections-to-2032.pdf
———. 2023c. Production, Supply, and Distribution Database. USDA Foreign Agriculture Service. Available online: https://apps.fas.usda.gov/psdonline/app/index.html#/app/advQuery
——— N.D. b. “Free Trade Agreements.” Office of the U.S. Trade Representative. Available online: https://ustr.gov/trade-agreements/free-trade-agreements
———. 2022. National Trade Estimate Report on Foreign Trade Barriers. Washington, DC: Office of the U.S. Trade Representative. Available online: https://ustr.gov/sites/default/files/2022%20National%20Trade%20Estimate%20Report%20on%20Foreign%20Trade%20Barriers.pdf
———. 2003, May 6. Quick Facts: U.S. – Singapore Free Trade Agreement. Washington, DC: Office of the U.S. Trade Representative. Available online:
https://ustr.gov/archive/Document_Library/Fact_Sheets/2003/Quick_Facts_US-Singapore_Free_Trade_Agreement.html
Whitton, C., D. Bogueva, D. Marinova, and C.J.C. Phillips. 2021, December 6. “Are We Approaching Peak Meat Consumption? Analysis of Meat Consumption from 2000 to 2019 in 35 Countries and Its Relationship to Gross Domestic Product.” Animals, 11(12). Available online: https://www.mdpi.com/2076-2615/11/12/3466
World Bank. 2010. Types of Tariffs. World Integrated Trade Solution. Available online: https://wits.worldbank.org/wits/wits/witshelp/content/data_retrieval/p/intro/c2.types_of_tariffs.htm#:~:text=
The%20bound%20tariff%20is%20the,rather%20than%20actually%20applied%20rates
World Trade Organization (WTO). 2021. Tariff Download Facility. Geneva, Switzerland. Available online: http://tariffdata.wto.org/ReportersAndProducts.aspx

