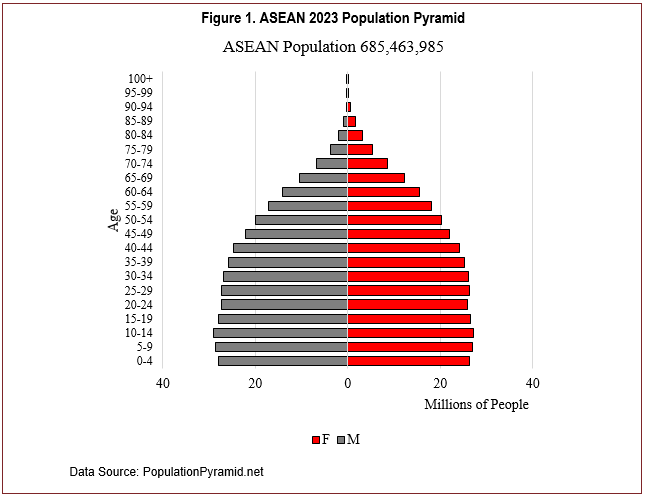
Exports account for approximately 20% of the total value of U.S. agricultural and food products (USDA, 2020). Expanding access to growing foreign markets can further enhance the value U.S. producers receive for their products, thus supporting farm income and rural communities. A potential source of export growth for U.S. agricultural and food products is the Association of Southeast Asian Nations (ASEAN) region (Lee and Jones, 2023), which includes Brunei, Cambodia, Indonesia, Laos, Malaysia, Myanmar (Burma), the Philippines, Singapore, Thailand, and Vietnam (ASEAN, 2023). Some of these countries (e.g., Vietnam, Indonesia, the Philippines) are major destination markets for U.S. agricultural exports. The region has an estimated population of over 685 million people, approximately 8.5% of the world’s 2023 estimated population of 8.03 billion. Additionally, over half of the ASEAN population is under 35 years old (Figure 1), and the middle class is expanding rapidly, from 41 million in 2000 to over 200 million in 2020 (Statista, 2022; Brueckner et al., 2017). These factors suggest that ASEAN will continue to be a major destination market for U.S. agriculture. While this special issue is focused on the potential for increased agricultural trade between the United States and ASEAN, this article summarizes the production and consumption of major agricultural commodities to assess the overall trade potential and potential for increased U.S. agricultural exports to the region.
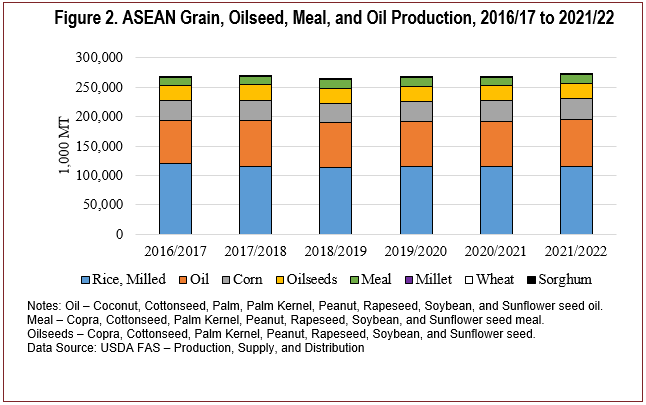
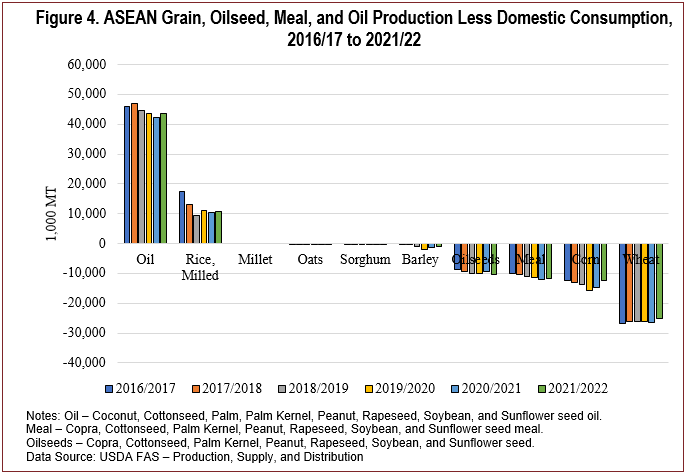
Notes: Oil – Coconut, Cottonseed, Palm, Palm Kernel,
Peanut, Rapeseed, Soybean, and Sunflower seed oil.
Meal – Copra, Cottonseed, Palm Kernel, Peanut,
Rapeseed, Soybean, and Sunflower seed meal.
Oilseeds – Copra, Cottonseed, Palm Kernel, Peanut,
Rapeseed, Soybean, and Sunflower seed.
Data Source: USDA FAS – Production, Supply, and
Distribution
Using USDA Foreign Agricultural Service (USDA-FAS) data we examine ASEAN production for four broadcategories: (i) grain, oilseeds, meal, and oil, (ii) dairy and meat products, (iii) select specialty crops, and (iv) cotton. As a share of global production, ASEAN countries contributed 36.6%, 23.2%, 7.5%, 4.3%, and 4.3% of total oil, rice, chicken meat, swine meat, and oilseed production, respectively. ASEAN countries also represented 21.1%, 15.3%, 9.7%, 7.4%, and 5.9% of rice, oil, cotton, chicken meat, and oilseed consumption, respectively.
Grain production in the region is dominated by rice, averaging an estimated 116.0 million metric tons (MMT) across the region (USDA-FAS, 2023, Figure 2). Among ASEAN countries, Indonesia, Vietnam, and Thailand are the top three rice producers. Corn, wheat, millet, and sorghum production is estimated at 35.3 MMT for 2021/2022, with an average of 35.0 MMT over the previous 5 years. Corn production was reported for eight of the ten ASEAN countries, with Indonesia, the Philippines, and Thailand being the top three producers. Myanmar was the only ASEAN country reporting wheat and millet production, and Thailand was the only country reporting sorghum production. For 2021/2022, oilseed, meal, and oil production were estimated at 26.5 MMT, 15.0 MMT, and 80.0 MMT, respectively, compared to previous 5-year averages of 25.7 MMT, 14.0 MMT, and 75.7 MMT, respectively. Oilseed and meal production are dominated by palm kernel production, accounting for over 65% and 60% of total production, respectively. Palm oil and palm kernel oil contribute over 94% of total oil production in the region. Indonesia is the largest regional producer of palm kernel, palm kernel oil, palm kernel meal, and palm oil.
Notes: Oil – Coconut, Cottonseed, Palm, Palm Kernel,
Peanut, Rapeseed, Soybean, and Sunflower seed
oil.Meal – Copra, Cottonseed, Palm Kernel, Peanut,
Rapeseed, Soybean, and Sunflower seed meal. Oilseeds
– Copra, Cottonseed, Palm Kernel, Peanut, Rapeseed,
Soybean, and Sunflower seed.Data Source: USDA FAS
– Production, Supply, and Distribution
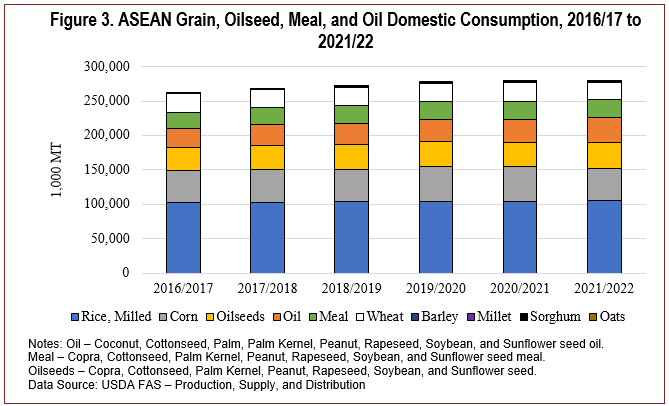
Domestic consumption of reported grains in the ASEAN region includes milled rice, corn, wheat, barley, millet, sorghum, and oats (Figure 3). Milled rice consumption accounted for 58.7% of regional grain consumption in 2021/022. Indonesia, Vietnam, and the Philippines were the top three domestic users of milled rice. Corn and wheat comprised 26.5% and 14.0% of regional grain consumption. Nine of the ten ASEAN countries reported corn consumption (the exception was Brunei). Regional consumption of oilseed, meal, and oil in 2021/2022 was 37.7 MMT, 26.7 MMT, and 36.4 MMT, respectively. For 2021/2022, 47.4% of oilseed consumption was palm kernel, 92.6% of oil use was palm and palm kernel oil, and 84.3% of meal use was soybean meal.
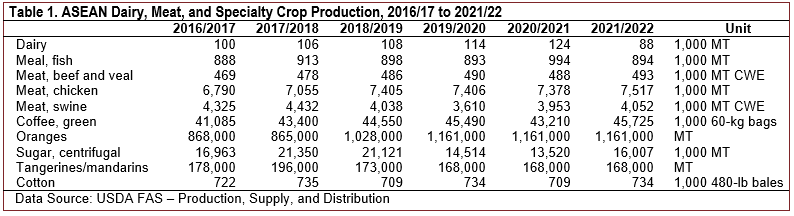
Domestic chicken meat production increased from 6.8 MMT in 2016/2017 to 7.5 MMT in 2021/2022 (Table 1). Thailand, Malaysia, and the Philippines were the top three producers of chicken meat in the region. Production of swine meat has fluctuated between 3.6 MMT carcass-weight equivalent (CWE) and 4.4 MMT CWE. Vietnam and the Philippines account for over 95% of reported swine meat production in the region. Beef and veal production in 2021/2022 was 493,000 MT CWE, 11,000 MT CWE above the previous 5-yearaverage. Vietnam, the Philippines, and Malaysia werethe only countries that reported beef and veal production. Fish meal production was 894,000 MT in 2021/2022 and averaged 917,000 MT in each of the previous 5 years. Vietnam and Thailand were the largest reported producers of fish meal. Dairy production was comprised of dry whole milk powder, cheese, and fluid milk. Of the 88,000 MT of dairy products produced in 2021/2022, 67.0% was dry whole milk powder, 30.7% was fluid milk, and 2.2% was cheese. The Philippines was the only country reporting fluid milk and cheese production in the ASEAN region. Thailand was the sole reported country for dry whole milk powder.
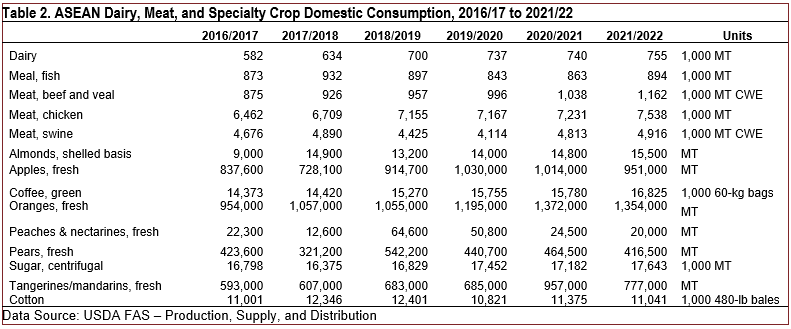
From 2016/2017 to 2021/2022, dairy consumption in the region increased from 582,000 MT to 755,000 MT (Table 2). This includes a 54.6% growth of fluid milk, 37.5% growth of nonfat dry milk, 25% growth of cheese, and 20.4% growth of dry whole milk powder. The reported increase in dairy consumption is from the Philippines and Indonesia. For 2021/2022, chicken, pork, and beef consumption were reported at 7.5 MMT, 4.9 MMT, and 1.2 MMT, respectively. Fish meal use, for 2021/2022 was 894,000 MT compared to a 5-year average of 881,600 MT.
ASEAN specialty crop production data reported by USDA-FAS were limited to green coffee, oranges, sugar, and tangerines/mandarins. Green coffee production was estimated at 45.7 million 60-kg bags for 2021/2022, with an average of 43.5 million 60-kg bags over previous 5-year period (Table 1). Vietnam, Indonesia, and Malaysia were the top three reported producers of green coffee. Orange production increased from 868,000 MT in 2016/2017 to 1.16 MMT in 2021/22. Vietnam was responsible for over 95% of reported orange production in the region. Tangerine and mandarin production averaged 176,600 MT between 2016/2017 and 2021/2022. Thailand and the Philippines were the only reporting countries. Seven out of ten ASEAN countries reported sugar production. Sugar production was 16.0 MMT in 2021/2022 and averaged 17.5 MMT over the previous 5 years. The top three sugar producers were Thailand, Indonesia, and the Philippines.
Notes: Oil – Coconut, Cottonseed, Palm, Palm Kernel,
Peanut, Rapeseed, Soybean, and Sunflower seed oil.
Meal – Copra, Cottonseed, Palm Kernel, Peanut,
Rapeseed, Soybean, and Sunflower seed meal.
Oilseeds – Copra, Cottonseed, Palm Kernel, Peanut,
Rapeseed, Soybean, and Sunflower seed.
Data Source: USDA FAS – Production, Supply, and
Distribution
ASEAN specialty crop consumption data reported by USDA-FAS included almonds, apples, green coffee, peaches and nectarines, pears, oranges, sugar, and tangerines/mandarins (Table 2). Thailand, Malaysia, and Indonesia accounted for all almond consumption reported. Apple consumption was reported in seven (Myanmar, Indonesia, Malaysia, Philippines, Singapore, Thailand, and Vietnam) of the ten ASEAN countries. Based on the reported data, ASEAN coffee consumption in 2021/2022 was 16,825 1,000 60 kg-bags, a slight increase relative to the 5-year average of 15,120 1,000 60-kg bags. Table 2 reports domestic consumption of oranges (Malaysia, Singapore, and Vietnam), tangerines and mandarins (Indonesia, Malaysia, Philippines, Thailand, and Vietnam), peaches and nectarines (Vietnam), pears (Myanmar, Indonesia, Malaysia, Philippines, Singapore, Thailand, and Vietnam), and apples (Myanmar, Indonesia, Malaysia, Philippines, Singapore, Thailand, and Vietnam). Among specialty crop consumption, a notable increase is seen in sugar consumption, which increased from 16.8 MMT in 2016/2017 to 17.6 MMT in 2021/2022.
Cotton production in the region was dominated by Myanmar, with a 5-year average production of 715,000 480-lb bales. Other reporting countries included Vietnam (3,000 480-lb bales), Indonesia (2,600 480-lb bales), the Philippines (2,000 480-lb bales), and Thailand (2,000 480-lb bales).
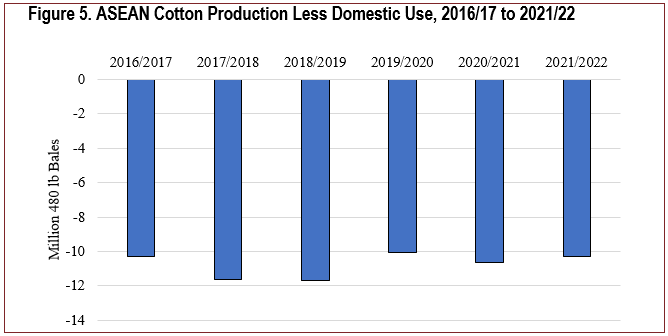
Domestic cotton use in the region was reported for eight of the ten countries (excluding Brunei and Laos). The top five cotton users were Vietnam (6.7 million bales), Indonesia (2.6 million bales), Thailand (725,000 bales), Myanmar (650,000 bales), and Malaysia (325,000 bales). Annual cotton use in the region ranged from 10.821 million bales to 12.346 million bales (Table 2).
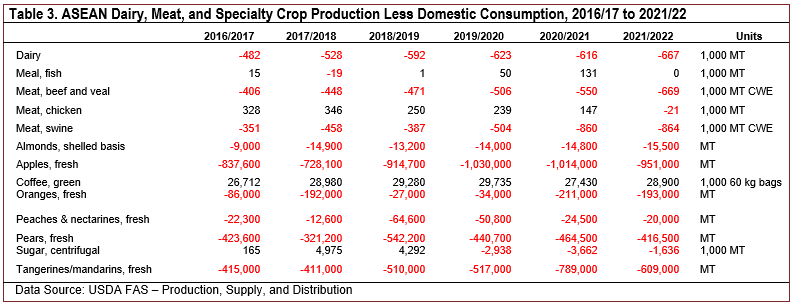
Using the reported production and consumption data above, we examine the surplus or deficit (production less consumption) for the selected agricultural commodities and products in the ASEAN. Oil (from oilseeds) and milled rice had consistent surplus production relative to consumption in the period examined (2016/2017 to2021/2022) (Figure 4). However, wheat, corn, oilseed meal, oilseeds, and barley had an average deficit of 26.1 MMT, 13.6 MMT, 11.0 MMT, 9.6 MMT, and 0.9 MMT, respectively. The average cotton deficit was 10.8 million bales (Figure 5). Additionally, Table 3 shows the annual deficit for dairy, meat, fish meal, and selected specialty crops. Expansion in the deficits occurred in beef, chicken, and pork meat during the 6-year period examined. Over those 6 years, sugar and chicken meat in the region transitioned from a surplus to a deficit.
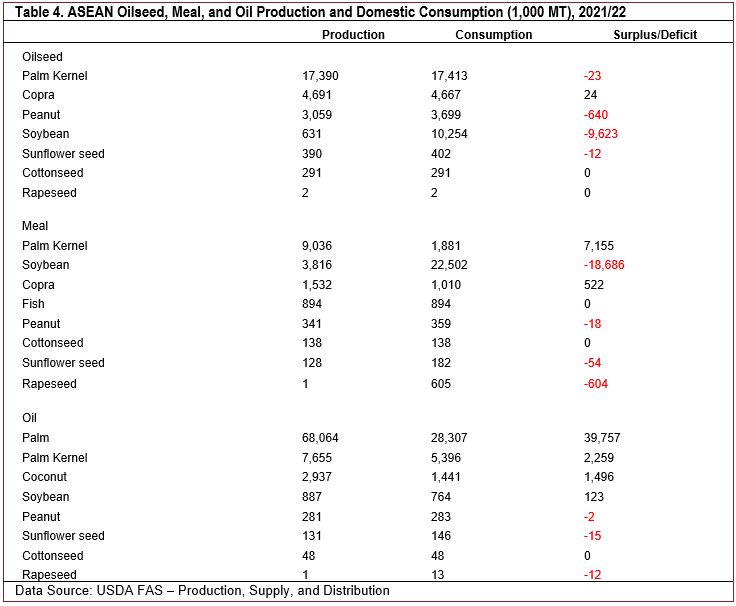
Surplus and deficits for types of oilseeds, different types of oilseed meals, and oils are shown in Table 4. In oilseeds, large deficits were in soybeans (9.6 MMT) and peanuts (0.6 MMT). In different types of oilseed meals, a surplus was for palm kernel (7.2 MMT) and a deficit (18.7 MMT) was for soybean meal. In oil production, the greatest surplus was in palm (39.8 MMT) and palm kernel oil (2.3 MMT). However, the relationship between oilseed, oil, and meal production in the region is complex, with meal and oilseed deficits and oil surpluses. Overall, there exist opportunities and potential future growth for U.S. oilseed meal and oilseed exports to the ASEAN region.
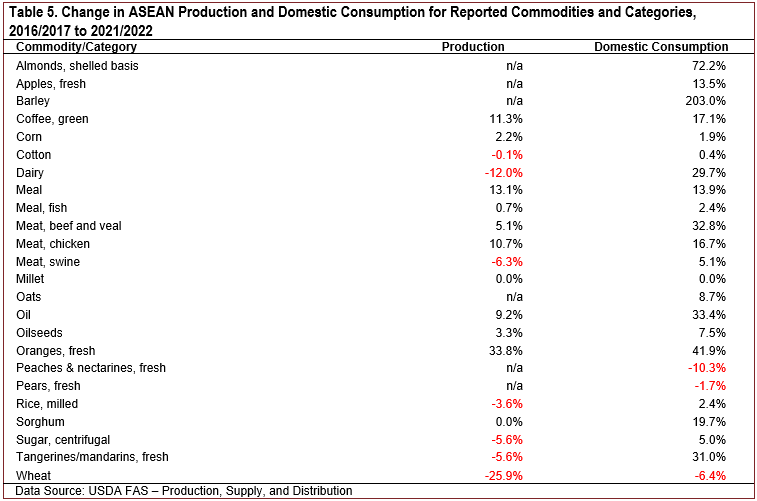
From 2016/2017 to 2021/2022, the five commodities or agricultural products with the largest growth in ASEAN production, in percentage terms, were oranges (33.8%), oilseed meal (13.1%), coffee (11.3%), chicken meat (10.7%), and oil (9.2%) (Table 5). Agricultural commodities and products with the largest reported decline in production, in the ASEAN region, were wheat (−25.9%), dairy (−12.0%), swine meat (−6.3%), sugar (−5.6%), and tangerines/mandarins (−5.6%). Swine meat production declines can be attributed, in part, to African Swine Fever.
Changes in consumption of agricultural commodities and products, from 2016/2017 to 2021/2022, provide further evidence of a growing middle class in the ASEAN region. Some notable increases in specialty crop consumption were reported in almonds, oranges, apples, tangerines/mandarins, and coffee beans (Table 5). Dairy consumption was up 29.7% in the region. Beef, chicken, and swine meat consumption were up 32.8%, 16.7%, and 5.1%, respectively. Oilseed meal, used primarily for feeding livestock, poultry, and aquaculture, was reported up 13.9%.
The projected population and economic growth of ASEAN countries make the region a desirable trade partner for U.S. agricultural commodities and products. Accessing markets through trade negotiations that reduce tariff and nontariff trade barriers will be an important step for U.S. agriculture to expand exports. The growth in ASEAN consumption and the expanding production-consumption deficit for soybeans, peanuts, soybean meal, beef, chicken, and swine meat, and specialty crops provide an opportunity for further U.S. agricultural trade to the ASEAN region.
This analysis is limited by the availability of USDA-FAS production and consumption data in the ASEAN region. USDA-FAS estimates provide the most consistent data over time but have incomplete coverage for the ASEAN region. As such, these data need to be interpreted cautiously.

