The H-2A visa program allows farm employers in the United States to hire guest workers to fill seasonal farm jobs if employers can demonstrate that U.S. workers are not available and the presence of H-2A workers will not adversely affect similar U.S. workers. Despite complaints that the H-2A program is costly and cumbersome, the number of seasonal jobs certified to be filled with H-2A workers has quadrupled over the past decade. H-2A workers now account for about 15% of average employment on U.S. crop farms and a higher share in southeastern states.
To be certified by the Department of Labor (DOL) to employ H-2A workers, farm employers must show that U.S. workers are not available and that the employment of H-2A workers will not adversely affect similar U.S. workers. To satisfy these two criteria, employers must:
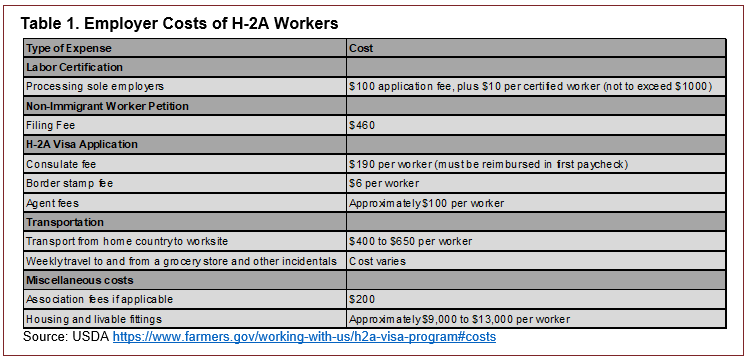
In Table 1, we present U.S. Department of Agriculture (USDA) estimates of select nonwage employer costs associated with the H-2A visa program (USDA, 2024). To apply for labor certification with DOL, there is a flat fee of $100, plus an additional $10 for each certified worker (not exceeding $1,000). The flat fee for filing a nonimmigrant worker petition with U.S. Citizenship and Immigration Services (USCIS) is $460. As pointed out by Roka, Simnitt, and Farnsworth (2017), this cost structure potentially urges employers to group as many workers onto a single petition as possible. Applying for 100 workers would cost$15.60 per worker ($11 per worker in labor certification and $4.60 per worker in nonimmigrant worker petition), while applying for 10 workers would cost four times more, at $66 per worker ($20 per worker in labor certification and $46 per worker in nonimmigrant worker petition).
The cost estimates provided by the USDA in Table 1 also account for fees paid to agents. There are two types of agents involved in the H-2A program: those in the United States who assist farmers in navigating the H-2A application process and recruiters abroad who help find workers for U.S. employers. Informal surveys of large H-2A employers suggest a typical recruitment fee of $100–$250 per worker and $1,500–$3,500 per application in US agent costs. A typical employer application requests 20 H-2A workers, making the cost of agent or attorney fees $75–$175 per worker, but these fees would be $15–$35 per worker for a contract requesting 100 workers. These costs vary with employer experience in the H-2A program and how much recruitment and processing work is done by the employer filing the application.
According to the USDA, the estimated cost of transporting H-2A workers to the United States from their home countries ranges from $400 to $650. Employers may also have to pay extra to transport workers from their temporary U.S. housing to the fields or orchards as well as provide meals or transportation to grocery stores if the employer is providing housing with cooking facilities. While these costs are not insignificant, they are much lower than the expenses associated with housing. While some U.S. employers and agents told us that USDA housing cost estimates were higher than the expenses they incurred, the USDA data in Table 1 suggest that housing costs range between $9,000 and $13,000 per worker, making it the biggest nonwage expense for H-2A employers.According to these estimates from the USDA, the minimum cost of nonwage expenses for H-2A workers is approximately $10,000 per worker. Castillo, Martin, and Rutledge (2022) found that a typical H-2A contract lasts 6 months and has a wage bill of $19,500. Combining the USDA’s minimum cost estimates of nonwage expenses, we can estimate that a typical H-2A worker contract costs at least $29,500. If employers were to hire U.S. workers who earned the same $19,500 wages, they would have to pay payroll taxes of 8%–12%. A 12% payroll tax would add $2,340 to the cost of hiring U.S. workers, narrowing the labor cost gap between H-2A workers and U.S. workers in states where employers do not have to pay H-2A workers unemployment insurance taxes.
However, some of the higher nonwage costs of H-2A workers could be offset if H-2A employees were more productive or provided labor insurance to their employers. For instance, if H-2A workers are 20% more productive than U.S. workers, the labor cost gap between U.S. workers and H-2A workers becomes less significant. A study by Simnitt and Onel (2023) found that H-2A citrus harvesters had piece-rate earnings that were 18%– 23% higher than unauthorized workers in Florida. H-2A workers are tied to their employers by contracts and are not subject to the risk of deportation, providing a form of labor insurance that ensures seasonal work is performed in a timely manner (Escalante et al., 2020).
The higher productivity of H-2A workers could help to explain the rapid expansion of the H-2A program despite its higher nonwage costs. DOL certified 12,200 employers to fill almost 372,000 jobs with H-2A workers in fiscal year 2022, a sevenfold increase since 2005. However, fewer than 10% of U.S. farm employers are certified to employ H-2A workers, and the largest 600 H-2A employers who were each certified for 100 or more H-2A workers accounted for two-thirds of all H-2A job certifications. Concentration has grown alongside H-2A expansion because the composition of H-2Aemployment has shifted from field and livestock operations, which tend to hire few H-2As, to fruits and vegetables and farm labor contractors (FLCs), sectors in which each employer hires more workers. FLCs—intermediaries who recruit farmworkers and bring them to farms—account for almost half of H-2A job certifications and are seven of the 10 largest H-2A employers.
In the rest of this article, we expand on past research (Bampasidou and Salassi, 2019; Luckstead and Devadoss, 2019; Martin, 2019; Castillo et al., 2021; Castillo et al., 2022; Martin and Rutledge, 2022) by examining growth and concentration in H-2A job certifications.
The H-2 program developed from World War II–era guest worker programs in the British West Indies (BWI) that brought workers from the Bahamas, Barbados, and Jamaica primarily to Florida. Farmers in western U.S. states obtained Mexican guest workers under a separate guest worker program, the Bracero Program, a series of Mexico–U.S. labor mobility agreements between 1942 and 1964. East Coast farmers did not hire Mexican braceros because they preferred their private arrangement with the BWI Central Labor Organization to obtain seasonal workers (Martin, 2007). The BWI program was codified as the H-2 program in the Immigration and Naturalization Act of 1952 that was enacted over President Truman’s veto. Unlike the Bracero Program, the H-2 program gave no official role in recruitment to governments in labor-sending countries.
Fewer than 15,000 jobs were certified to be filled by H-2 farm workers during the 1950s, when most of the H-2 farm workers were Jamaicans who cut sugarcane in southern Florida and picked apples along the Eastern Seaboard. Under the Bracero Program, DOL was charged with ensuring that the employment of braceros did not adversely affect the wages and working conditions of similar U.S. workers, which was done by establishing an adverse effect wage rate (AEWR) of $0.30/hour in most years ($3.58 in 2023 dollars) (Public Law 78, 1951; Bracero History Archive, 2023). This AEWR minimum wage did not apply to U.S. workers employed alongside braceros.
The Bracero Program ended in 1964, and many farmers expected to continue to hire Mexican workers under the H-2 program. However, the DOL issued regulations on December 19, 1964, that required employers of H-2 workers to offer and pay the AEWR to any U.S. workers they employed (Martin, 2007, pp. 15–16). Unlike bracero employers, H-2 employers were also required to offer and provide U.S. workers with the same housing and transportation guarantees that were included in bracero contracts. At a time when U.S. farm workers were not covered by minimum wage laws, most U.S. farmers adjusted to the end of the Bracero Program by mechanizing or changing crops rather than continuing to rely on migrant workers (Clemens, Lewis, and Postel, 2018).
The 1964 DOL regulations governed the H-2 program until the Immigration Reform and Control Act (IRCA) of 1986 separated H-2 into H-2A for seasonal farm jobs and H-2B for seasonal nonfarm jobs. DOL issued H-2A regulations on June 1, 1987, that are the bedrock of current program rules. DOL must certify that (i) U.S. workers who are “able, willing and qualified” are not and will not be available to fill the seasonal jobs for which the employer is requesting H-2A workers and (ii) that the employment of the H-2A workers will not adversely affectU.S. workers who are “similarly employed.”
These recruitment and no-adverse-effect regulations are implemented by requiring employers to file job orders with DOL and state workforce agencies (SWAs) 60–75 days before work is to begin. SWAs use job orders to recruit U.S. workers. These job orders specify the number of H-2A workers the employer requests, details of the work to be performed, wages and hours, and housing and transportation arrangements. U.S. workers fill less than 2% of advertised “H-2A jobs,” and DOL certifies over 97% of employer requests for H-2A jobs, or 372,000 of the 382,000 requests in FY22 (Martin, 1998; DOL, 2023).
IRCA was expected to end unauthorized migration and expand the H-2A program from fewer than 20,000 jobs in the late 1980s to over 200,000 jobs in the 1990s as formerly unauthorized farm workers who were legalized under IRCA found nonfarm jobs. The threat of sanctions on employers who hired unauthorized workers was expected to deter unauthorized foreigners from entering the United States (Commission on Agricultural Workers, 1993).However, unauthorized migration and employment continued in the 1990s. One contributing factor was that unauthorized workers could provide false documents to employers, thus satisfying requirements that workers present and employers see work-authorization documents. The National Agricultural Workers Survey (NAWS) found that the share of IRCA-legalized workers among U.S. crop workers fell from one-third in 1989–1990 to less than one-sixth by the mid-1990s, while the share of unauthorized workers rose from less than 10% to 50% (Martin, 2012). As a result, the number of H-2A jobs certified rose slowly to 50,000 by the early 2000s. The number of H-2A jobs certified remained stable until FY05, and then crept upward during the economic boom preceding the 2008–2009 recession. This uptick was partially attributed to farmworkers finding employment opportunities in the construction sector and other booming industries (Castillo and Charlton, 2022).
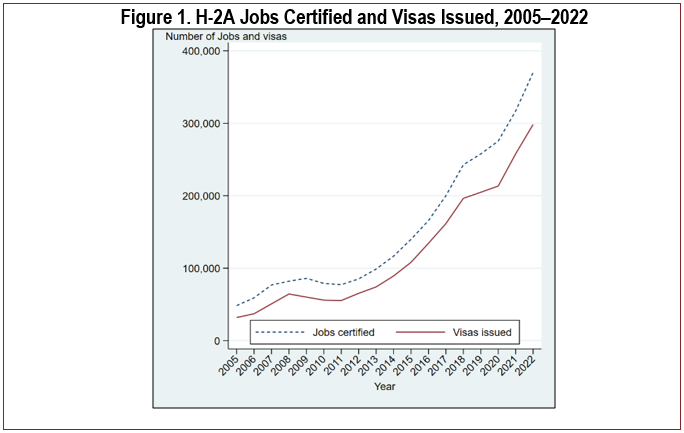
As shown in Figure 1, the past decade has seen a surge in H-2A certifications. A combination of factors could account for this recent upswing. First, as noted by Passel and Cohn (2019), large-scale unauthorized migration from Mexico to the United States slowed during the recession and did not resume with the recovery. Second, there was likely a degree of path dependence associated with farm employers and FLCs who developed experience and expertise with H-2A workers and realized that commodities with long seasons and predictable work weeks— such as citrus—had similar labor costs using H-2A or U.S. workers (Guan, Roka, and Whidden, 2015; Simnitt and Onel, 2023). Third, enforcement of U.S. immigration laws was stepped up inside the United States, and Arizona and many southeastern states enacted laws that required all employers to use E-Verify, an internet-based system that allows employers to check the authenticity of worker-presented documents. Some made unauthorized presence in the state a crime to discourage unauthorized foreigners from remaining in the state (Kostandini, Mykerezi, and Escalante, 2014; Charlton and Kostandini, 2020; Ifft and Jodlowski, 2022; Luo and Kostandini, 2022).
The number of jobs certified to be filled by H-2A workers topped 300,000 in fiscal year 2021 and is on track to top 400,000 in fiscal year 2023, representing a doubling of the program within 6 years. H-2A visas are issued to workers for about 80% of H-2A jobs certified because some employers do not follow through to fill some or all of their certified H-2A jobs with H-2A workers, some of whom can fill two or more H-2A jobs. In fiscal year 2022, a large share of visas, some 276,000 or 93%, of H-2A visas went to Mexicans. South Africans and Jamaicans received a smaller share, with 9,500 (3%) and 4,900 (2%), respectively. The remaining 2% of visas granted in FY22 were received by workers from all other eligible countries.
If current trends continue, H-2A job certifications will surpass peak mid-1950s bracero admissions of 455,000 before 2025. Other reasons why the H-2A program is expected to continue to expand include the aging and settling of the unauthorized crop workforce that arrived before the 2008–2009 recession (Fan et al., 2015), robust demand for labor in sectors that compete with agriculture for workers (Castillo and Charlton, 2022), and the reluctance of unauthorized foreigners who pay high smuggling fees or apply for asylum and receive work permits to accept seasonal farm jobs. Economies of scale in the recruitment and management of H-2A workers may also contribute to the growth and concentration of H-2A employment.
Most H-2A jobs are certified to a relatively small number of farm employers. Some 110,000 agricultural establishments are registered with state unemployment insurance (UI) agencies (these farm establishments include agricultural support firms such as farm labor contractors), and over 437,000 farms reported labor expenses for directly hired workers in the 2022 Census of Agriculture (COA). Most UI and COA farm employers hire relatively few workers. The 10% of UI-covered farm establishments with 10 or more employees (about 11,000) in the second quarter of 2022 (the only quarter for which size of employer data are available) accounted for 80% of total UI-covered agricultural employment, while the 8% of farms that each hired 10 or moreworkers directly in the COA, about 37,000, accounted for 55% of all directly hired workers in 2022.
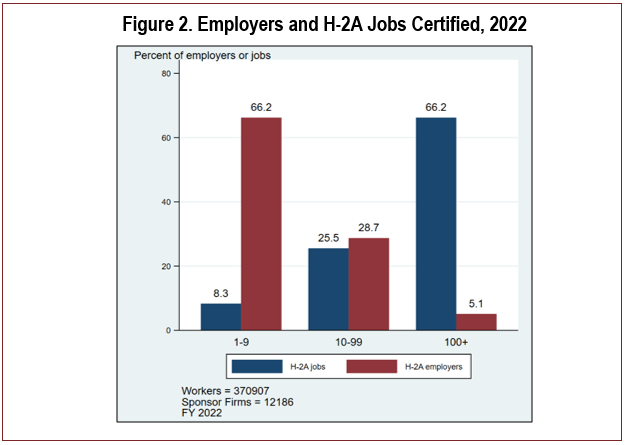
Employment in the H-2A program is more concentrated.Some 12,200 unique employers were certified to fill almost 372,000 seasonal farm jobs with H-2A workers in fiscal year 2022, an average of 32 each (many employers file several applications). As shown in Figure 2, the 5% of H-2Aemployers (around 620) who were each certified for 100 or more H-2A workers accounted for two-thirds of all certified H-2A
jobs in fiscal year 2022, an average of 400 each, and the 115 employers who were each certified to hire 500 or more H-2A workers accounted for 40% of all H-2A jobs certified, an average of 1,300 each. DOL analysts spend most of their time processing applications from employers who are certified for less than 10 workers and collectively account for 8% of total H-2A certifications (Martin, 2007).
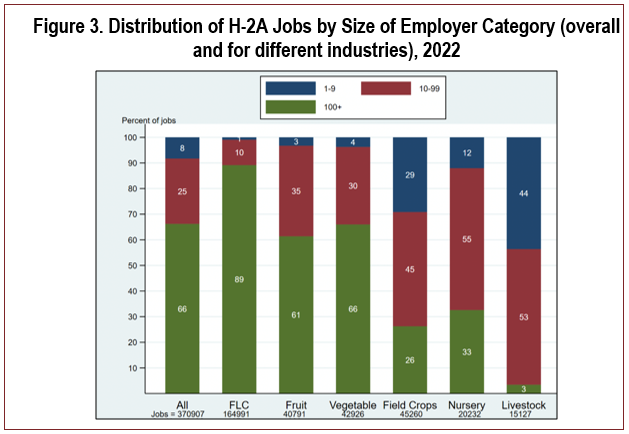
The industry mix of H-2A job certifications varies significantly across employer size categories. In fiscal year 2022, two-thirds of all H-2A job certifications are for FLCs and fruit and vegetable (F&V) growers who hire H-2A workers directly. Castillo et al. (2021) showed that within the H-2A program, FLCs primarily serve end-user farms specializing in F&V production. However, FLCs and F&V employers are more prevalent among large H-2A employers, accounting for 82% of the jobs certified to employers with 100 or more certifications. At the other end of the size spectrum, FLCs and F&V employers account for only 14% of the jobs certified to employers for less than 10 H-2A workers. Around two-thirds of H-2A job certifications for small employers go to those engaged in field crop cultivation and livestock operations.
These differences by industry are more apparent when examining the distribution of H-2A certifications by size of employer for different industries. As Figure 3 shows, almost 90% of FLC H-2A jobs are certified to FLCs with 100 or more H-2A certifications, as are over 60% of H-2A fruit jobs and two-thirds of H-2A vegetable jobs. By contrast, only a quarter of field crop, a third of nursery, and 3% of livestock H-2A jobs are certified to employers with 100 or more H-2A certifications.
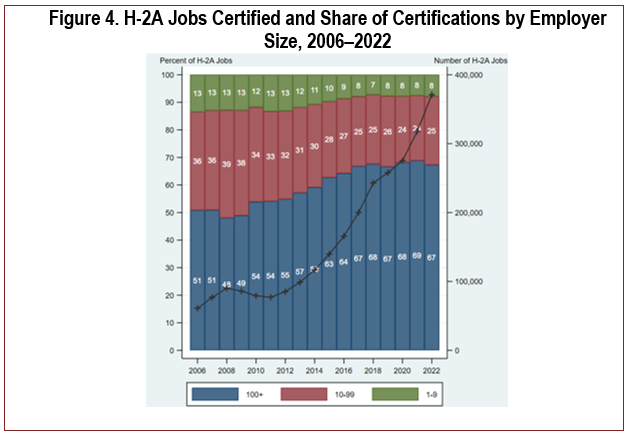
The growth of the H-2A program has been accompanied by an increased concentration of H-2A job certifications among employers who are certified for 100 or more H-2A workers. The stacked bar chart in Figure 4 shows how H-2A jobs are distributed among different employersize categories each year. The blue part of the barsrepresents the share of H-2A jobs going to employershiring 100 or more workers, the red part shows theshare going to employers hiring 10–99 workers, and the green part represents the share going to those hiring 1–9 workers. The black line graph plotted against the right vertical axis shows the total number of H-2A jobs per year. A likely reason for this growing concentration is a shift in the distribution of H-2A employment from commodities such as tobacco, corn, and livestock operations to
FLCs, fruits, and vegetables. Between fiscal years 2006 and 2022, the number of H-2Acertifications increased by more than six-fold, while the share of H-2A certifications going to employers who arecertified for 100 or more H-2A workers rose from half to two-thirds.
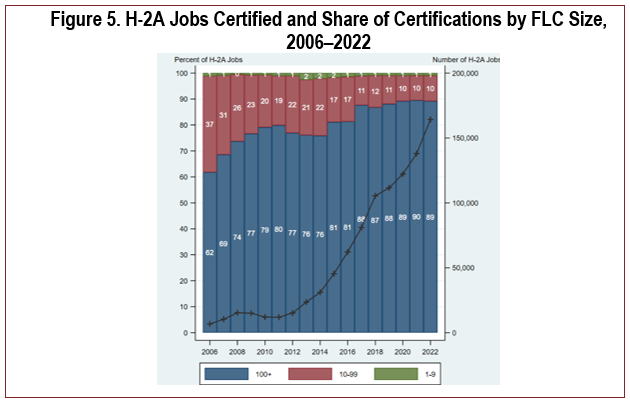
Figure 5 shows that growth and concentration are especially apparent for the FLCs that account for almost half of H-2A job certifications. The share of H-2A jobs certified to FLCs that were each certified for 100 or more H-2A workers rose steadily from fiscal year 2005 to 2022, so that about 90% of the jobs certified to FLCs went to those with 100 or more certifications.
The H-2A program is expanding rapidly. Over the last decade, certifications for farm jobs filled by legal foreign temporary workers quadrupled, and they are projected to exceed the peak Bracero Program admissions of 455,000 by 2025. This growth stems from factors that include reduced flows of unauthorized workers willing to fill seasonal farm jobs and the aging of the largely unauthorized farm workforce that arrived before the 2008–2009 recession (Luckstead and Devadoss, 2019).
Many farm employers initially avoided the H-2A program due to recruitment, housing, and AEWR costs (Guan, Roka, and Whidden, 2015). Some hoped that immigration reforms like the Farm Workforce Modernization Act (FWMA), which the House passed in 2019 and 2021, would make it easier and cheaper to employ legal guest workers (Bampasidou and Salassi, 2019). The FWMA would have, inter alia, legalized unauthorized farm workers, mandated continued farm work for unauthorized farm workers who want immigrant visas, and made H-2A employment cheaper for employers. The FWMA would also open 20,000 year-round jobs to H-2A workers by removing the current restriction that all H-2A jobs must be seasonal, thus opening livestock, dairy, and greenhouse jobs to H-2A workers. Despite the support of many farm organizations and advocates, the FWMA was not enacted and the H-2A program remains the primary route for farm employers to hire guest workers.
An Act to Amend the Agricultural Act of 1949, P.L. 78, 65 STAT. Title V: Agricultural Workers. 119, 82nd Congress. 1951. Available online: https://www.govinfo.gov/content/pkg/STATUTE-65/pdf/STATUTE-65-Pg119.pdf
Bampasidou, M., and M. Salassi. 2019. “Trends in U.S. Farm Labor and H-2A Hired Labor: Policy and Related Issues.” Choices 34(1).
Bracero History Archive. 2023. Introduction and Background Information for Teachers. Available online: https://braceroarchive.org/teaching.
Castillo, M., and D. Charlton. 2022. “Housing Booms and H-2A Agricultural Guest Worker Employment.” American Journal of Agricultural Economics 105(2):709–731 .
Castillo, M., P. Martin, and Z. Rutledge. 2022. The H-2A Temporary Agricultural Worker Program in 2020. United States Department of Agriculture, Economic Research Service, Economic Information Bulletin, 238.
Castillo, M., S. Simnitt, G. Astill, and T. Minor. 2021. Examining the Growth in Seasonal Agricultural H-2A Labor. Economic Information Bulletin EIB-226. Washington, DC: U.S. Department of Agriculture, Economic Research Service.
Charlton, D., and G. Kostandini. 2020. “Can Technology Compensate for a Labor Shortage? Effects of 287 (g) Immigration Policies on the U.S. Dairy Industry.” American Journal of Agricultural Economics 103:70–89.
Clemens, M.A., E.G. Lewis, and H.M. Postel. 2018. “Immigration Restrictions as Active Labor Market Policy: Evidence from the Mexican Bracero Exclusion.” American Economic Review 108:1468–1487.
Commission on Agricultural Workers. 1993. Report of the Commission on Agricultural Workers. Available online: https://books.google.com/books/about/Report_of_the_Commission_on_Agricultural.html?id=DstFAAAAYAAJ
Escalante, C., T. Luo, and C. Taylor. 2020. “The Availability of H-2A Guest Farm Workers during the COVID-19 Pandemic.” Choices 35(3).
Fan, M., S. Gabbard, A. Aves Pena, and J.M. Perloff. 2015. “Why Do Fewer Agricultural Workers Migrate Now?” American Journal of Agricultural Economics 97(3):665–679.
Guan, Z., F. Wu, F. Roka, and A. Whidden. 2015. “Agricultural Labor and Immigration Reform.” Choices 30(4).
Ifft, J., and M. Jodlowski. 2022. “Is ICE Freezing U.S. Agriculture? Farm-Level Adjustment to Increased Local Immigration Enforcement.” Labour Economics 78:102203.
Kostandini, G., E. Mykerezi, and C. Escalante. 2014. “The Impact of Immigration Enforcement on the U.S. Farming Sector.” American Journal of Agricultural Economics 96(1):172–92.
Luckstead, J., and S. Devadoss. 2019. “The Importance of H-2A Guest Workers in Agriculture.” Choices 34(1).
Luo, T., and G. Kostandini. 2022. “Stringent Immigration Enforcement and Responses of the Immigrantâ€Intensive Sector: Evidence from Eâ€Verify Adoption in Arizona.” American Journal of Agricultural Economics 104(4): 1411–1434.
Martin, P. 1998. “Congress: Guest Workers.” Rural Migration News 4(2). Available online: https://migration.ucdavis.edu/rmn/more.php?id=274
———. 2007. Evaluation of the H-2A Alien Labor Certification Process and the U.S. Farm Labor Market. Report prepared for the U.S. Department of Labor. Available online: https://wdr.doleta.gov/research/FullText_Documents/ETAOP_2013_04.pdf.
———. 2012. “Hired Farm Workers.” Choices 27(2).
———. 2019. “The Role of the H-2A Program in California Agriculture.” Choices 34(1).
Martin, P., and Z. Rutledge. 2022. “Proposed Changes to the H-2A Program Would Affect Labor Costs in the United States and California.” California Agriculture 75(3):135–141.
Passel, J., and D. Cohn. 2019, June 12. “Mexicans Decline to Less Than Half the U.S. Unauthorized Immigrant Population for the First Time.” Pew Research Center. Available online: https://www.pewresearch.org/short-reads/2019/06/12/us-unauthorized-immigrant-population-2017.
Roka, F., S. Simnitt, and D. Farnsworth. 2017. “Pre-Employment Costs Associated with H-2A Agricultural Workers and the Effects of the ‘60-Minute Rule.’” International Food and Agribusiness Management Review 20(3):335–346.
Simnitt, S., and G. Onel. 2023. “Earnings Differentials between H-2A and Unauthorized Citrus Harvesters in Florida.” Agricultural and Resource Economics Review 52(3):547–562.
U.S. Department of Agriculture (USDA). 2024. Costs of the H-2A Visa Program. Available online:https://www.farmers.gov/working-with-us/h2a-visa-program#costs [Accessed January 9, 2024].
U.S. Department of Labor (DOL). 2023. H-2A Disclosure Data [data set]. Available online: https://www.dol.gov/agencies/eta/foreign-labor/performance.
Wafla. Housing Solutions. Available online: https://www.wafla.org/housing/ [Accessed January 9, 2024].
Zahniser, S., J.E. Taylor, T. Hertz, and D. Charlton. 2018. Farm Labor Markets in the United States and Mexico Pose Challenges for U.S. Agriculture. Economic Information Bulletin EIB-201. Washington, DC: U.S. Department of Agriculture, Economic Research Service.

