U.S. solar energy production increased threefold from 2017 to 2022 (Hodge, 2023) as the federal government aimed to achieve carbon-free electricity by 2035 to combat climate change (Mamun et al., 2022; Gomez-Casanovas et al., 2023; U.S. Department of Energy, 2023). Solar energy has been the fastest-growing electric power sector since 2023, with this growth expected to persist through 2025 (Hess and Tsai, 2024). Solar energy production is increasing in cropland areas due to cropland’s higher solar potential, flat surface, and proximity to electrical infrastructure (Adeh et al., 2019; Katkar et al., 2021; U.S. Department of Energy, 2023). The solar future study projected that about 10.3 million acres (41,683 km2) of land would be required for the large-scale electrification and decarbonization of buildings and transportation (Heath et al., 2022). This creates land-use competition between solar energy development and agricultural production, causes community opposition, and delays the development of projects. Collocating solar panels with crops—agrivoltaics (AVs)—is an innovative approach to minimize this competition (Macknick et al., 2022; Pascaris et al., 2022) and increase the efficiency of cropland use (Gomez-Casanovas et al., 2023) while reducing community opposition to traditional solar energy projects (Pascaris et al., 2021).
Despite the higher solar potential, solar energy production is limited in the southeastern region (Sengupta et al., 2018) because of the higher PV installation costs and lower electricity prices. When investing in AV, the southeastern region can benefit from the Rural Energy for America Program (REAP)—a policy designed to support investments in renewable energies made by agricultural producers or rural small business owners (Pascaris, 2021; Steinberg et al., 2023). AVs reduce community opposition to solar energy, minimize land competition between energy and food production, and facilitate solar penetration in the rural United States. Thus, AVs can be a potential option for joint solar energy and food production in the southeastern United States. Economic analyses of AVs in other areas in the United States suggest that AVs increase revenue and profit compared to crops alone (Majumdar and Pasqualetti, 2018; Cuppari, Higgins, and Characklis, 2021). However, the profitability of AV in the southeastern United States is unclear. We aim to fill this gap.
In this article, we examine the profitability of tomato and strawberry agrivoltaics (TAV and SBAV, respectively) and the impact of REAP on AV profitability under various solar panel configurations. We focused on the effects of REAP on AV because producers could benefit from this policy by making energy-efficient improvements, such as AV project development, on their farms. Tomatoes and strawberries are popular crops in the southeastern United States, with economic, social, and cultural significance. Tomato and strawberry producers often diversify their farm operations, connecting the community through agritourism, revitalizing the producer’s market and rural economy, creating seasonal jobs, supplying local fresh products, and hosting social events and festivals (Sweet Grown Alabama, 2024; Velasco, 2024). AV adoption enhances farm diversification and generates additional revenue through agritourism, project demonstration, and social events. TAVs and SBAVs have the potential to increase farm profitability while providing access to clean energy and helping to mitigate climate change in this region. Our analysis uses Alabama as a representative state for the southeastern US. In what follows, we will explain the AV configurations, calculation methods, and profit from TAVs and SBAVs. We will further discuss the impact of the REAP on AV farm profit and make policy recommendations.
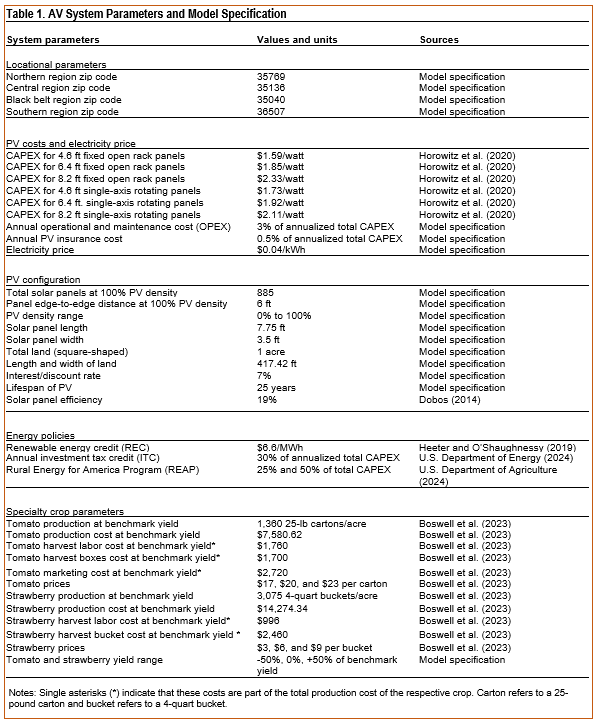
We calculated the revenue, cost, and profit of TAVs and SBAVs for a hypothetical 1-acre, square-shaped plot in four regions of Alabama. The parameters for the calculation are presented in Table 1. We assumed the number and size of crop plots remain unaffected by PV density—the number of solar panels per acre—because solar panels are mounted on metallic poles at 4.2 feet or higher to accommodate cultural operations and plant maturation height. We excluded land rent, assuming that the producer owns cropland, grows crops, and operates the established AV. We calculated the direct current (DC) system size and total annual energy output at the given PV densities using the PVWatts Calculator (Dobos, 2014; National Renewable Energy Laboratory, 2024), using the exact PV specifications specified in the calculator.
We varied tomato and strawberry yields from a 50% decrease to a 50% increase from their benchmark yields to account for crop yield uncertainty in the AVs because of crop, soil, microclimate, and PV interactions (Mamun et al., 2022; Gomez-Casanovas et al., 2023). Solar panels provide shade to plants, reducing heat, temperature, and water stresses. The interactions among increased disease resistance, improved water use efficiency, reduced sunlight, change in microbial composition, and soil disturbances may increase or
decrease crop yield and fruit quality (Al-agele et al., 2021; Barron-Gafford et al., 2019; Mamun et al., 2022; Omer et al., 2022; Othman et al., 2020; Walston et al., 2018; Weselek et al., 2021; Willockx et al., 2022). The interactions among crops, PV parameters, soil, and microclimate variation are less understood for tomatoes and strawberries due to the need for more research. We varied harvest, labor, packaging, and marketing costs proportionately with the crop yield from the tomato and strawberry enterprise budgets compiled by the Alabama Co-operative Extension System (Boswell et al., 2023). The budgets do not vary across the state. Thus, we assumed that the cost of crop production and expectedyield are constant across the state.
We assume that the producers receive a federal investment tax credit (ITC) and renewable energy credit (REC), and part of the initial capital investment cost (CAPEX) is compensated through REAP within 6 months. We calculated 6 months of simple interest on compensated CAPEX and summed it with the uncompensated portion of the CAPEX as a loan to repay over 25 years. We multiplied annual energy production by the electricity price and subtracted annual PV cost to estimate annual profit from energy production. The total annual cost for the PV includes loan repayment, insurance, and operational and maintenance costs. Finally, we generated all combinations of energy and crop profits and added them to estimate total AV profits. The complete analysis has 814,968 AV combination outcomes for each crop, and each REAP scenario, which can be accessed on GitHub (https://github.com/bijubjs/AVAlabama)
Based on the parameters listed in Table 1, the annual profit from PV alone at 50% REAP and 100% PV density ranges from $4,070 to $16,348 per acre, depending upon electricity price, solar array types, and operation region. At 25% REAP, the loss from PV alone at 100% PV density ranges from $1,580 to $20,030 per acre. The annual profits from tomatoes and strawberries alone under benchmark yield and price from 1 acre of land are $9,619 and $4,176, respectively. In the remaining part of this section, we discuss the profits from TAVs and SBAVs.
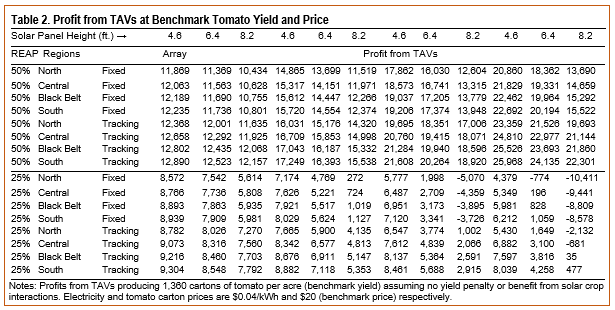
The annual profit from 1,360 cartons of tomato alone produced on 1 acre and sold at $20 per carton is $9,619. When 50% of total PV CAPEX is compensated through the REAP (henceforth, “50% REAP” for 50% compensation; “25% REAP” for 25% compensation), the profits from TAV at benchmark yield and crop price from an acre of land range from $10,434 to $25,968, depending upon PV density, panel heights, array types, and geographical regions (Table 2). At 50% REAP, benchmark yield, and crop price, TAVs are profitable in all scenarios, and the profit increases in PV density. However, at 25% REAP and benchmark yield and price, TAVs are less profitable than tomatoes alone. TAVs become unprofitable throughout the state at 25% REAP, 75% or higher PV density, and fixed panels raised above 8.2 ft. The TAV profit is reduced by 27% to 176% at the benchmark yield and price depending upon PV configuration and location if REAP is reduced from 50% to 25%.
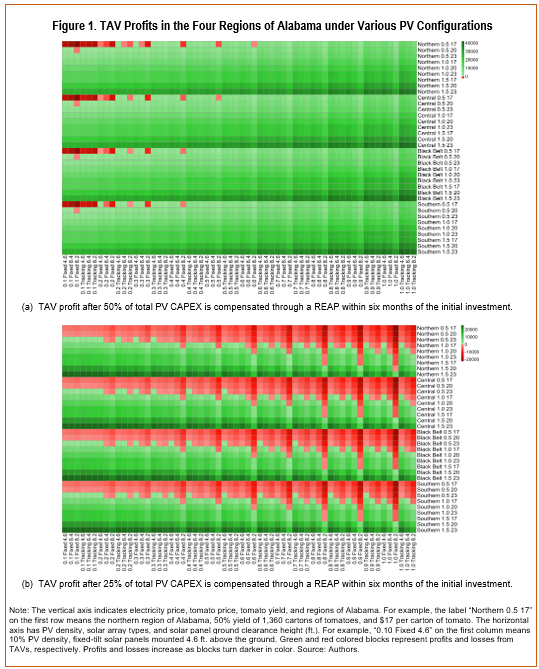
Figure 1 shows a set of two 2,160 TAV profit scenarios under 50% REAP (Figure 1a) and 25% REAP (Figure 1b), respectively. At 50% REAP, most of the TAV scenarios are profitable (Figure 1a), but some are less profitable than crops alone. For example, TAV is break-even or more profitable than crop alone at benchmark yield and $17 price when tracking panels are placed at 40% density. Under the same crop yield and price, higher profit from AV than the tomato alone can be achieved at 30% PV density with fixed panels mountedat 4.6 feet. At 50% REAP and higher PV densities, TAVs are mostly profitable even if the yield dropped by 50% and price dropped to $17. For example, TAVs become unprofitable in the northern region at 50% REAP when yield loss is 50%, tomato price is $17 per carton, andfixed panels with 60% PV density are mounted at 8.2 feet. TAV with the same configurations and crop prices becomes unprofitable in the Black Belt and southern regions, at 40% PV density.
Many TAV scenarios become unprofitable at 25% REAP (Fig: 1b). In this case, almost all TAVs become unprofitable if tomato yield is reduced to 50% of the benchmark yield across the state for all prices. The TAV profit at a $17 per bucket of tomatoes depends upon other system parameters. TAVs are unprofitable at a $17 tomato price and 8.2-foot-high fixed panels at 80% or above PV density. For TAVs to become profitable at 25% REAP, producers should either lower PV height to 4.2 feet, maintain benchmark or higher yield, receive $20 or above market price, or maintain combinations of more than one of these conditions. Tomato yield must increase by 50% and receive at least $20 per carton for TAVs to remain profitable in all four regions when 8.2-foot-tall fixed solar panels cover 80% of the plot. When fixed panels are mounted at 8.2 feet at 100% PV density, tomato yield must increase by 50% and receive a market price of $23 per 25 pounds for TAV to remain profitable in northern Alabama. The losses from TAVs generally decrease as we progress toward the south from the north due to higher solar energy production, but they are still insufficient to make a profit.
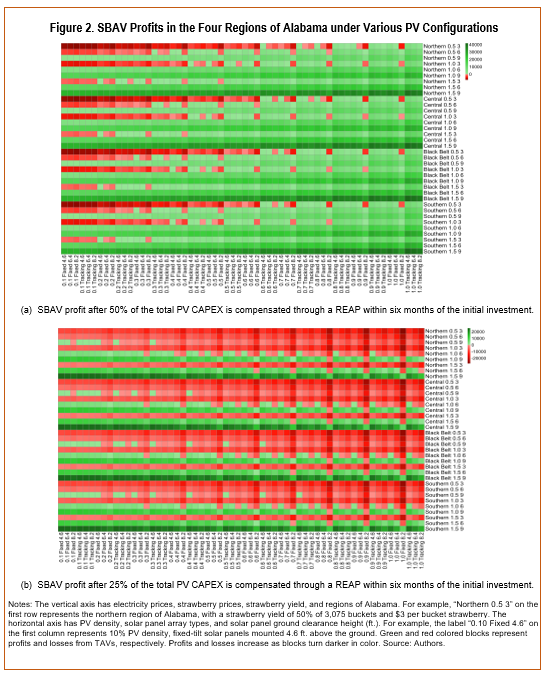
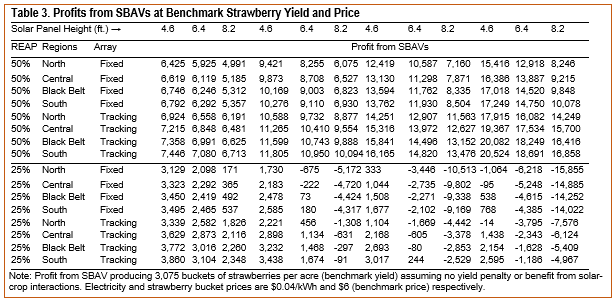
The annual profit from 3,075 buckets of strawberries produced in an acre and sold at $6 per bucket is $4,176. At 50% REAP, profits from SBAV from an acre of land range from $4,991 to $20,524, depending upon AV configuration and geographical region (Table 3). At 50% REAP and benchmark yield and price, SBAV is profitable across all scenarios, and the profit increases with the PV density. However, at 25% REAP, the profit from the crop alone is higher than the profit from SBAV, and the profit decreases in PV density. SBAVs observe losses throughout the state at 25% REAP, benchmark yield, and price in almost all scenarios. The SBAV profit is reduced by 72% to 417% at the benchmark yield and price depending upon PV configuration and location if REAP is reduced from 50% to 25%.
Figure 2 shows 2,160 SBAV profit outcomes at 50% REAP (Fig: 2a) and 2,160 SBAV profit outcomes at 25% REAP (Fig: 2b). SBAVs are mostly profitable at 50% REAP when PV densities are higher, panel height 6.4 feet or lower, yields remain at benchmark or higher level, and the strawberry price is $6/bucket or more (Fig: 2a). However, at lower prices and yield, the profitability of SBAVs depends upon panel heights, panel arrays, PV density, and geographical regions. A few unprofitable SBAV configurations in the north became profitable in the south for the same crop yield and prices because of the increase in solar energy production. For example, SBAV with 8.2-foot-tall tracking solar panels, 70% PV density, benchmark yield, and strawberry priced at $3 per bucket become profitable except in the northern region. However, SBAV profits are smaller than crop only in several profitable scenarios. For example, except in the northern region, SBAV profit is higher than strawberry alone at benchmark yield and $3 strawberry price, 70% PV density, and 4.6-foot tracking panels. Under the same configuration, yield, and crop prices, SBAV profit higher than strawberry profit alone across the state is achieved at 80% PV density.
However, most SBAVs become unprofitable (Figure 2b) at 25% REAP. SBAVs become unprofitable at $3 per bucket even if the strawberry production increases by 50% across all scenarios. At 25% REAP, SBAVs remained profitable at the benchmark yield and $9 strawberry price with fixed panels mounted at 6.4 feet or lower. SBAVs become unprofitable at 60% or above PV densities and 8.2-foot tracking panels with the same configurations and prices as above. For SBAVs to become profitable at 25% REAP, either strawberry yield must increase by 50% or the strawberry price must remain at the benchmark price or above in most scenarios. At 25% REAP, SBAV profit decreases in solar panel density. Only a few unprofitable scenarios at 25% REAP and lower PV densities become profitable as we progress toward the southern region from the north because of increased solar energy production.
We examined the profitability of TAVs and SBAVs in Alabama under two REAP scenarios varying height, array, and density of solar panels, crop yield, crop price, and geographical regions. We found that TAV and SBAV will be more attractive to producers at 50% REAP because they are mostly profitable compared to crops alone. Holding crop yield constant, the AV profits also increase in PV density at 50% REAP, which could further increase solar energy production. At 25% REAP, producing the crop alone is more profitable than AVs, even though some AV scenarios remain profitable. Reducing the REAP from 50% to 25% may make AVs less attractive because producers lose profit by allocating agricultural land to the PV. Producers further lose money by increasing PV density at 25% REAP, making AVs unattractive. It is nearly impossible to make AVs profitable without REAP or similar incentives. Decreasing the CAPEX for PV could change the outcome in the future.
Some unprofitable AV scenarios at benchmark crop yield become profitable at the higher yield for a given price and PV configuration. Higher crop prices at a given yield make AV scenarios profitable without modifying PV configurations. Increasing crop yield under the AV system may help maintain farm profit if REAP is reduced from 50% to 25%. Even though producers could maintain profit with 25% REAP by increasing crop yield by 50%, the current state of research is insufficient to predict a 50% increase in yield. More research is necessary to study the impact of AVs on tomato and strawberry yield and crop performance
Adeh, E., S. Good, and C. Higgins. 2019. “Solar PV Power Potential Is Greatest over Cropland.” Scientific Reports 9(6): 11442.
Al-agele, H.A., K. Proctor, G. Murthy, and C. Higgins. 2021. “A Case Study of Tomato (Solanum lycopersicon var. legend) Production and Water Productivity in Agrivoltaic Systems.” Sustainability 13(5).
Barron-Gafford, G.A., M.A. Pavao-Zuckerman, R.L. Minor, L.F. Sutter, I. Barnett-Moreno, D.T. Blackett, M. Thompson, K. Dimond, A.K. Gerlak, G.P. Nabhan, and J.E. Macknick. 2019. “Agrivoltaics Provide Mutual Benefits Across the Food–Energy–Water Nexus in Drylands.” Nature Sustainability 2:848–855.
Boswell, J., C. East, A. Majumdar, E. Sikora, and J. Kemble. 2023. “Enterprise Budgets for Horticulture Crops.” Albama A&U and Auburn Universities Extension. Available online: https://www.aces.edu/blog/ topics/farm-management/enterprise-budgets-for-horticulture-crops/ [Accessed July 26, 2024]
Cuppari, R.I., C.W. Higgins, and G.W. Characklis. 2021. “Agrivoltaics and Weather Risk: A Diversification Strategy for Landowners.” Applied Energy 291: 116809.
Dobos, A.P. 2014. Pvwatts Manual Version 5. Available online: https://doi.org/10.2172/1158421
Gomez-Casanovas, N., P. Mwebaze, M. Khanna, B. Branham, A. Time, E.H. DeLucia, C.J. Bernacchi, A.K. Knapp, M.J. Hoque, X. Du, X., et al. 2023. “Knowns, Uncertainties, and Challenges in Agrivoltaics to Sustainably Intensify Energy and Food Production.” Cell Reports Physical Science 4(8).
Heath, G., D. Ravikumar, S. Ovaitt, L. Walston, T. Curtis, D. Millstein, H. Mirletz, H. Hartmann, and J. McCall. 2022. Environmental and Circular Economy Implications of Solar Energy in a Decarbonized U.S. Grid. National Renewable Energy Laboratory Technical Report NREL/TP-6A20-80.
Heeter, J.S., and E. O’Shaughnessy. 2019. Status and Trends in the Voluntary Market (2018 Data). National Renewable Energy Laboratory.
Hess, T., and K. Tsai. 2024. “We Expect Solar Will Supply Almost All Growth in U.S. Electricity Generation through 2025.” Today in Energy. Available online: https://www.eia.gov/todayinenergy/detail.php?id=61203# [Accessed October 3, 2024]
Hodge, T. 2023. “Increasing Renewables Likely to Reduce Coal and Natural Gas Generation over Next Two Years.” Today in Energy. Available online: https://www.eia.gov/todayinenergy/detail.php?id=55239# [Accessed July 29, 2024]
Horowitz, K., V. Ramasany, J. Macknick, and R. Margolis. 2020. Capital Costs for Dual-Use Photovoltaic Installations:2020 Benchmark for Ground-Mounted PV Systems with Pollinator-Friendly Vegetation, Grazing, and Crops. National Renewable Energy Laboratory Technical Report NREL/RP-6A20-77811.
Katkar, V.V., J.A. Sward, A. Worsley, and K.M. Zhang. 2021. “Strategic Land Use Analysis for Solar Energy Development in New York State.” Renewable Energy 173:861–875.
Macknick, J., H. Hartmann, G. Barron-Gafford, B. Beatty, R. Burton, C. Seok-Choi, M. Davis, R. Davis, J. Figueroa, A. Garrett, et al. 2022. The 5 Cs of Agrivoltaic Success Factors in the United States: Lessons from the Inspire Research Study. National Renewable Energy Laboratory Technical Report NREL/TP-6A20-83566.
Majumdar, D., and M.J. Pasqualetti. 2018. “Dual Use of Agricultural Land: Introducing ‘Agrivoltaics’ in Phoenix Metropolitan Statistical Area, USA.” Landscape and UrbanPlanning 170:150–168.
Mamun, M.A.A., P. Dargusch, C. Wadley, N.A. Zulkarnain, and A.A. Aziz. 2022. “A Review of Research on Agrivoltaic Systems.” Renewable and Sustainable EnergyReviews 161:112351.
National Renewable Energy Laboratory. 2024. Pvwatts Calculator.https://pvwatts.nrel.gov/pvwatts.php [Accessed December 5, 2024]
Omer, A.A.A., W. Liu, M. Li, J. Zheng, F. Zhang, X. Zhang, S.O.H. Mohammed, L. Fan, Z. Liu, F. Chen, et al. 2022. “Water Evaporation Reduction by the Agrivoltaic Systems Development.” Solar Energy 247:13–23.
Othman, N.F., M.E. Yaacob, A.S. Mat Su, J.N. Jaafar, H. Hizam, M.F. Shahidan, A.H. Jamaluddin, G. Chen, and A. Jalaludin. 2020. “Modeling of Stochastic Temperature and Heat Stress Directly Underneath Agrivoltaic Conditions with Orthosiphon Stamineus Crop Cultivation.” Agronomy 10(10):1472.
Pascaris, A.S. 2021. “Examining Existing Policy to Inform a Comprehensive Legal Framework for Agrivoltaics in the U.S.” Energy Policy 159:112620.
Pascaris, A.S., C. Schelly, L. Burnham, and J.M. Pearce. 2021. “Integrating Solar Energy with Agriculture: Industry Perspectives on the Market, Community, and Socio-Political Dimensions of Agrivoltaics.” Energy Research & Social Science 75:102023.
Pascaris, A.S., C. Schelly, M. Rouleau, and J.M. Pearce. 2022. “Do Agrivoltaics Improve Public Support for Solar? a Survey on Perceptions, Preferences, and Priorities.” GreenTechnology, Resilience, and Sustainability 2(1):8.
Sengupta, M., Y. Xie, A. Lopez, A. Habte, G. Maclaurin, and J. Shelby. 2018. “The National Solar Radiation Data Base (NSRDB).” Renewable and Sustainable Energy Reviews 89: 51–60.
Steinberg, D.C., M. Brown, R. Wiser, P. Donohoo-Vallett, P. Gagnon, A. Hamilton, M. Mowers, C. Murphy, and A. Prasanna. 2023. Evaluating Impacts of the Inflation Reduction Act and Bipartisan Infrastructure Law on the U.S. Power System.National Renewable Energy Laboratory Technical Report NREL/TP-6A20-85242
Sweet Grown Alabama. 2024. “Find Sweet-Grown Alabama Products.” Available online: https://www.sweetgrownalabama.org/find-sweet-grown [Accessed July 29, 2024]
U.S. Department of Agriculture. 2024. Rural Energy for America Program: Renewable Energy Systems & Energy Efficiency Improvement Guaranteed Loans. Available online: https://www.rd.usda.gov/programs-services/energy-programs/rural-energy-America-program-renewabe-energy-systems-energy-efficiency-improvement-guaranteed-loans[Accessed July 26, 2024]
U.S. Department of Energy. 2023. Investing in American Energy: Significant Impacts of the Inflation Reduction Act and Bipartisan Infrastructure Law on the U.S. Energy Economy and Emissions Reductions. Department of Energy Office of Policy.
———. 2024. Federal Solar Tax Credits for Businesses. Available online: https://www.energy.gov/eere/solar/federal-solar-tax-credits-businesses[Accessed July 26, 2024]
Velasco, E. 2024. “13 Alabama Strawberry Farms and Festivals to Visit This Season.” Alabama News Center. Available online https://alabamanewscenter.com/2024/03/17/13-Alabama-strawberry-farms-and-festivals-to-visit-this-season/[Accessed July 29, 2024]
Walston, L.J., S.K. Mishra, H.M. Hartmann, I. Hlohowskyj, J. McCall, and J. Macknick. 2018. “Examining the Potential for Agricultural Benefits from Pollinator Habitat at Solar Facilities in the United States.” Environmental Science & Technology 52(13):7566–7576.
Weselek, A., A. Bauerle, J. Hartung, S. Zikeli, I. Lewandowski, and P. Högy. 2021. “Agrivoltaic System Impacts on Microclimate and Yield of Different Crops Within an Organic Crop Rotation in a Temperate Climate.” Agronomy for Sustainable Development41(5):59.
Willockx, B., A. Kladas, C. Lavaert, U. Bert, and J. Cappelle. 2022. “How Agrivoltaics Can Be Used as a Crop Protection System.” EUROSIS Proceedings: 130–136.

