Using data from the 2012 and 2017 U.S. Census of Agriculture, Sawadgo and Plastina (2022) summarized regional trends of adoption and disadoption of cover crops and no-till in the United States by Farm Resource Region (USDA, 2000) and highlighted the impact of large-scale disadoption in net adoption of conservation practices. They found that cover crops and no-till area increased by 5.0 and 7.9 million acres across the 48 contiguous states of the United States, respectively, between 2012 and 2017. However, in the absence of disadoption in counties with net attrition in area, cover crop and no-till area could have been 0.9 and 5.2 million acres higher, respectively, totaling 5.9 and 13.1 million acres in 2017.
The large-scale disadoption of conservation practices is concerning from the short-term perspective of lower immediate potential of soil health systems to benefit farmers and society (Stevens, 2019) and from the medium-term perspective of eroding the stock of benefits from years of regenerative practices. Wade and Claassen (2017), for example, report that one tillage pass to reduce weed pressure can release back into the atmosphere the carbon sequestered in the soil over multiple years of sustained no-till.
Further, given the increased availability of technical and financial support to implement conservation practices through federal programs, the analysis of regional patterns of adoption and disadoption is critical to inform the discussion regarding the short- and long-term effectiveness of those programs. For example, the available funding for the Environmental Quality Incentives Program (EQIP) administered by the U.S. Department of Agriculture (USDA) National Resource Conservation Service increased by 19.6% between 2012 and 2017 from $1.38 to $1.65 billion (113th Congress, Agricultural Act of 2014) and by an additional 12.1% between 2017 and 2022 to $1.85 billion (115th Congress, Agriculture Improvement Act of 2018). In addition, the Pandemic Cover Crop Program was firstoffered nationwide by the USDA in 2021 and provides a $5 per acre reduction of crop insurance premiums on cover-cropped acres, covering $59.5 million in premiums in its first year (USDA 2022a).
Cover crops and no-till are key practices in all voluntary carbon farming initiatives in the United States (Plastina and Wongpiyabovorn, 2021; USDA, 2023). However, the impermanence of carbon sequestered in the soil through conservation practices that are later discontinued or disadopted due to farmers exiting farming or selling land for nonfarm development (Jackson-Smith et al., 2010) or due to alternating or opportunistic adoption (Pannell and Claassen, 2020) can result in significant quality discounts to carbon credits generated from farming practices (Wongpiyabovorn, Plastina, and Crespi, 2023).
In this article, we expand the regional analysis of adoption and disadoption of cover crops and no-till in the United States conducted by Sawadgo and Plastina (2022) using data from the recently released 2022 U.S. Census of Agriculture (USDA, 2024). Our goal is to raise awareness about the continued prevalence of disadoption as a major barrier to area expansion in key conservation practices, despite increasing technical and financial support from public programs and growing incentives from voluntary carbon farming initiatives to implement them.
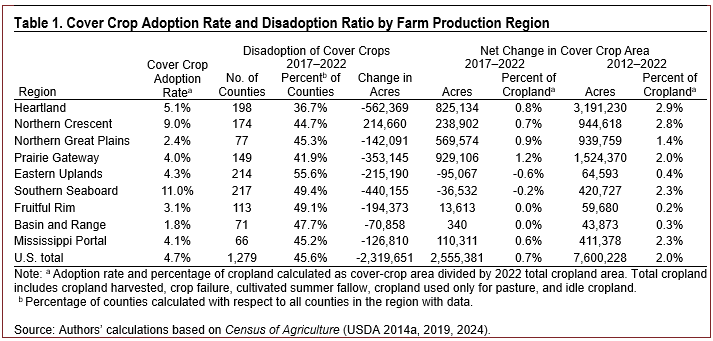
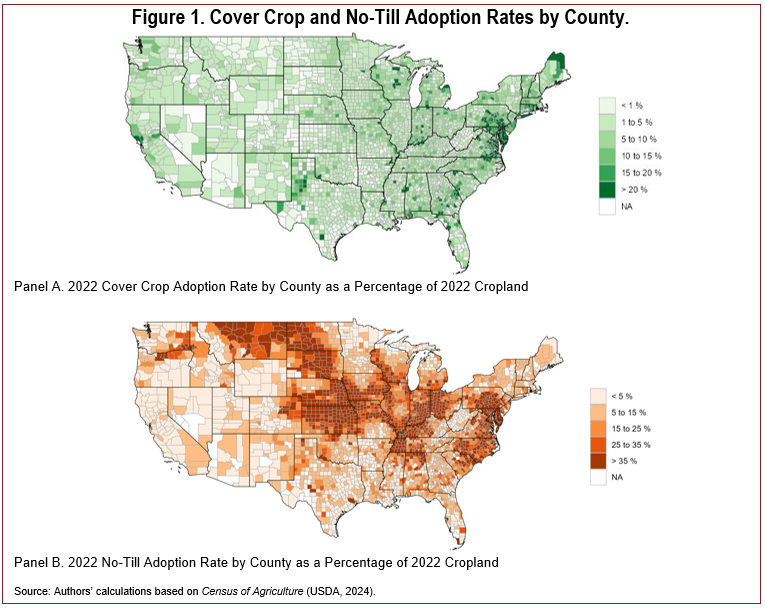
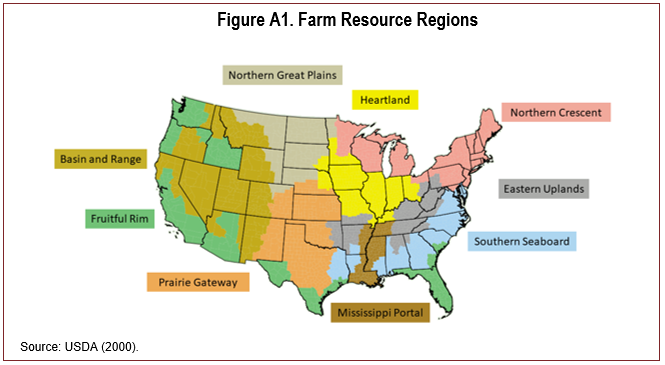
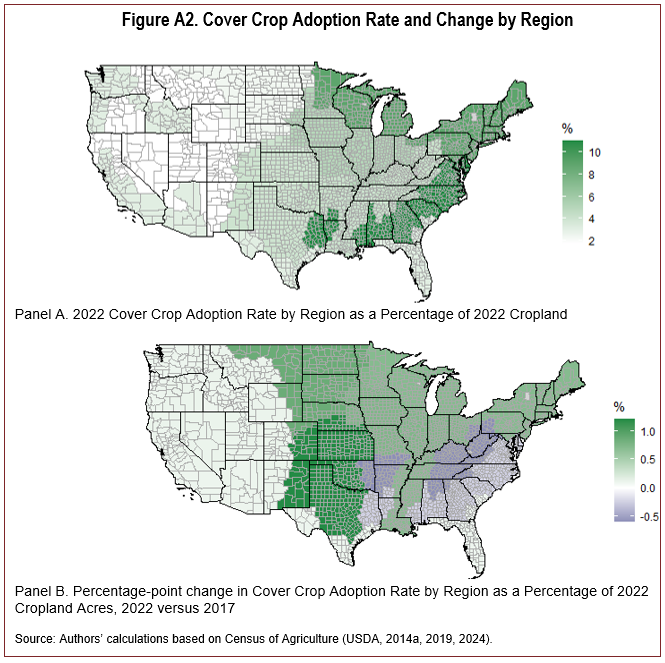
Cover crops were planted on 4.7% of total cropland acres across the 48 contiguous states of the United States in 2022, up from 4.0% in 2017 and 2.7% in 2012 (Table 1). Figure 1 (Panel A) illustrates the rate of adoption of cover crops by county in 2022. Figure 2 shows the percentage-point change in the adoption rate from 2017 to 2022 (Panel A) and over the entire decade ending in 2022 (Panel B). To gain a better understanding of adoption trends, results are aggregated across the nine Farm Resource Regions (USDA, 2000), depicted in Appendix Figure A1. Regional cover crop adoption levels and changes from 2017 to 2022 are shown in Appendix Figure A2, Panels A and B, respectively. The Heartland region largely coincides with the Corn Belt and is characterized by cash grains and cattle farms; it produces more than two-thirds of all U.S. corn. The Northern Crescent is mainly composed of dairy, general crop, and cash grain farms and produces about one-tenth of the U.S. corn crop. The Northern Great Plains are characterized by wheat, cattle, and sheep farms. Cattle, wheat, sorghum, cotton, and rice farms are typical in the Prairie Gateway region, and corn production there accounts for about 15% of the national corn crop (Foreman, 2001). The Eastern Uplands region has the largest number of small farms of any region, producing cattle part-time, tobacco, and poultry. Part-time cattle, general field crops, and poultry farms characterize production in the Southern Seaboard. The Fruitful Rim is characterized by fruit, vegetable, nursery, and cotton farms. The Basin and Range region has the smallest share of cropland and is dominated by cattle, wheat, and sorghum farms. Last, cotton, rice, poultry, and hog farms predominate in the Mississippi Portal.
While cover crops were implemented on an additional 0.7% of cropland acres in 2022 with respect to 2017 across the nation, only five regions (Prairie Getaway, Northern Great Plain, Heartland, Northern Crescent, and Mississippi Portal) experienced area increases beyond 0.5% of their cropland in that period; two regions remained stagnant (Fruitful Rim and Basin and Range), and two regions saw net decreases in area (Eastern Uplands and Southern Seaboard). The Farm Resource Region with the highest adoption rate in 2022 was the Southern Seaboard (11.0%), followed by the Northern Crescent (9.0%) and the Heartland (5.1%). One reason for regional patterns for cover-crop adoption and disadoption is differences in the suitability of the practiceto address different resource concerns (USDA, 2014b) and their interaction with insurable cash crop rotations (USDA, 2020). A second, and perhaps more impactful, reason for regional adoption patterns is differences in state-level policies to promote conservation practices (Wallander et al., 2021; Sawadgo and Plastina, 2021; Sawadgo, 2024). The adoption rate in the Southern Seaboard is likely due to state cost-share programs in Delaware, Maryland, and Virginia that promote practices to address water-quality issues in Chesapeake Bay. Similar programs exist in Pennsylvania and Ohio of the Northern Crescent region, to address water-quality issues in Chesapeake Bay and Lake Erie. Iowa and Indiana have created state-level programs more recently, possibly explaining the position of the Heartland region.
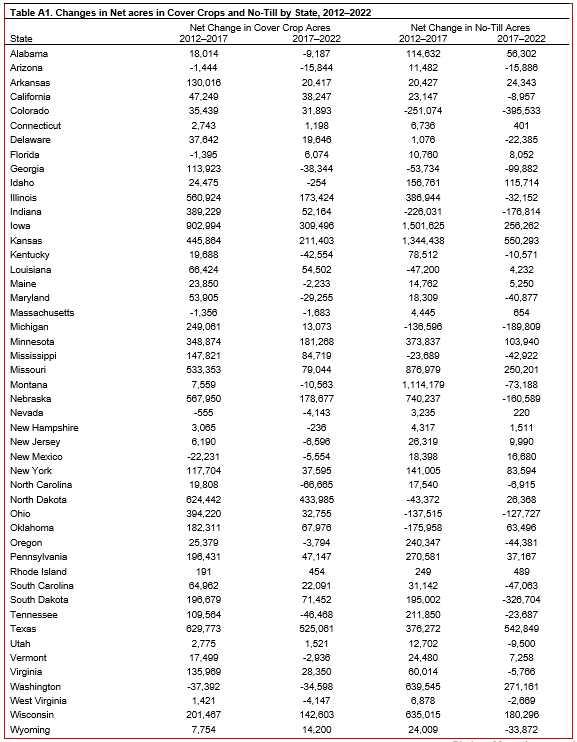
While the Southern Seaboard and Northern Crescent regions also had the highest adoption rates in 2017 (11.2% and 8.3%, respectively), the Heartland region displaced the Eastern Uplands from third place in 2022. However, the largest adoption gain between 2017 and 2022 occurred in the Prairie Gateway, where 0.93 million additional acres were planted to cover crops, equivalent to 36% of the national net change in cover-cropped area. Over the entire decade under analysis, cover-cropped area increased the most in the Heartland: 3.2 million acres that accounted for 42% of all the net change in cover crop area across the nation. The Prairie Getaway had the second largest expansion in area between 2012 and 2022: 1.5 million acres or 20% of the national net increase in cover-cropped area. Three states (Texas, North Dakota, and Iowa) accounted for half of the net increase in cover-cropped acres in the nation (Table A1 in Appendix).
Two regions, the Eastern Uplands and the Southern Seaboard, saw a slight net disadoption of cover crops in 2017–2022 (less than 100,000 acres), eroding 60% and 8%, respectively, of the inroads made in area expansion over 2012–2017. Nineteen states (North Carolina, Tennessee, Kentucky, Georgia, Washington, Maryland, Arizona, Montana, Alabama, New Jersey, New Mexico, West Virginia, Nevada, Oregon,Vermont, Maine, Massachusetts, Idaho, and New Hampshire) jointly experienced a total disadoption of 325,054 acres in 2017–2022.
Disadoption also played an important role in limiting the net expansion of cover crop area at the national level between 2017 and 2022: 1,279 counties, or 45.6% of all counties in the contiguous U.S. states, disadopted a total of 2,319,651 acres (Table 1). In the absence of disadoption in counties with net area attrition, the net expansion of cover crop area would have been 4.9 million acres larger, bringing total cover-cropped area to 5.3% of U.S. cropland. The disadoption of cover crops has been more widespread and intensive in the 2017–2022 period than over the 2012–2017 period, occurring across 416 extra counties (1,279 versus 863 counties), and reducing area by an additional 1.4 million acres (2.3 versus 0.9 million acres).
Overall, the adoption of cover crops decelerated between 2017–2022 and 2012–2017, as demonstrated by the lower percentage changes in net area across all regions in 2017–2022 with respect to the corresponding values for 2012–2022 in Table 1. The accelerated disadoption observed across periods seems contrarian to the hypothesis that noncontinuous use of cover crop practices, or “alternating adoption” (Pannell and Claassen, 2020) might be major determinants of this trend, even after recognizing that a large proportion of cover-cropped acreage only uses the practice 1 or 2 years out of a 4-year period (Wallander et al., 2021). Further, continuous cover-cropped land was shown to increase in Indiana from 2011 to 2019 (Tran and Kurkalova, 2023). However, our finding of cover-crop disadoption supports prior findings that Mississippi Delta farmland in cover crops is likely to transition into other practices rather than remain in cover crops (Pathak et al., 2024).
It is also plausible that cover-crop disadoption is simply due to the economic incentives of a changing agricultural economy. Both crop prices and input prices mostly increased between 2017 and 2022. Cover crops have been shown to have negative net returns due to decreased subsequent cash-crop yields (Plastina et al., 2018a, 2018b, 2020; Thompson et al., 2020; Sellars, Schnitkey, and Gentry, 2023) and increased input costs (Hughes and Langemeier, 2020; Clay et al., 2020; Hancock et al., 2020), which are reasons why financial barriers are a deterrent to adoption (Duke et al., 2022). Under a yield decline from their use, higher crop prices would increase the opportunity cost of using cover crops, further decreasing potential net returns from cover crops. Increased input costs—especially for cover-crop seed—would also decrease net returns to cover crops and even further hinder adoption.
Farmer adoption of cover crops has largely depended on cost-share programs administered by the USDA, state governments, nongovernmental organizations, or private firms (Schnitkey, Sellars, and Gentry, 2023). However, cost-share payments from some programs have not increased with the rising input costs, meaning that the farmer portion of cover-crop expenditures increased. Our findings would also support the idea that farmers are more likely to stop participating in working lands’ programs when agricultural market conditions are favorable (Pathak, Wang, and Adusumilli, 2024). If the observed disadoption trend continues, it could have serious negative implications for the credibility and stability of voluntary markets for carbon and ecosystem services.
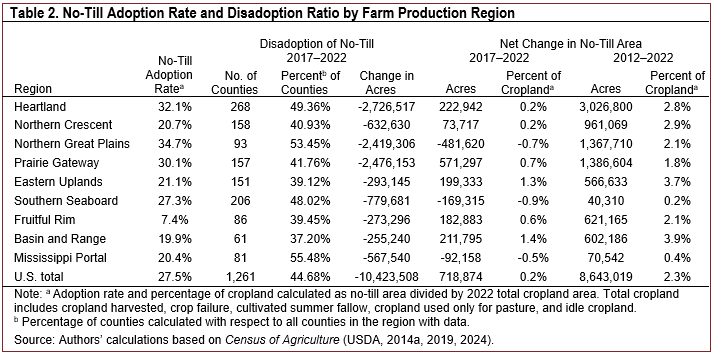
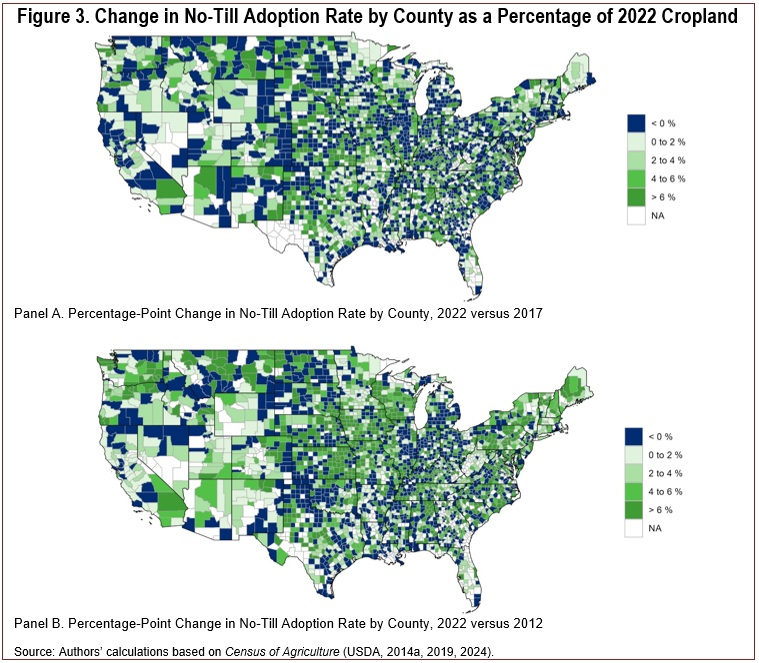
No-till is a much more widely adopted conservation practice than are cover crops, accounting for 27.5% of total cropland acres in 2022, up from 27.3% in 2017 and 25.3% in 2012 (Table 2). Figures 1 (Panel B) and A3 (Panel A) illustrate the rate of adoption of no-till by county and region in 2022, respectively. Figure 3 shows the percentage-point change in the adoption rate by county from 2017 to 2022 (Panel A), and over the entire 2012–2022 period (Panel B).
While no-till was implemented on an additional 0.2% of cropland acres in 2022 with respect to 2017 across the nation, only four regions (Eastern Uplands, Basin and Range, Prairie Getaway, and Fruitful Rim) experienced no-till area increases beyond 0.5% of their cropland in that period, two regions remained almost stagnant (Heartland and Northern Crescent), and three regions saw net decreases in area (Southern Seaboard, Northern Great Plains, and Mississippi Portal). The Northern Great Plains saw the highest adoption rate (34.7%) in 2022, followed by the Heartland (32.1%), the Prairie Gateway (30.1%), and the Southern Seaboard (27.3%). The regional no-till adoption patterns may reflect the prevalence of highly erodible land across the Northern Great Plains, Heartland, and Prairie Gateway regions. Farmers may use no-till as part of their conservation plan required to enroll highly erodible land in USDA programs (USDA, 2016, 2022b).
However, the Prairie Gateway topped the list with 0.6 million additional acres in no-till, accounting for 79% of the total area expansion in the United States between 2017 and 2022. Over the entire decade under analysis, no-till area increased the most in the Heartland: 3.0 million acres that accounted for 35% of all the net change in no-till area in the nation. The Prairie Getawayand the Northern Great Plains had the second and third largest expansion in area over the decade, each with 1.4 million acres or 16% of the national net increase in area. The states of Texas and Kansas, each adding more than 0.5 million acres in no-till over the period (Table A1 in Appendix), accounted for 152% of the national net change in no-till acres (718,874 acres).
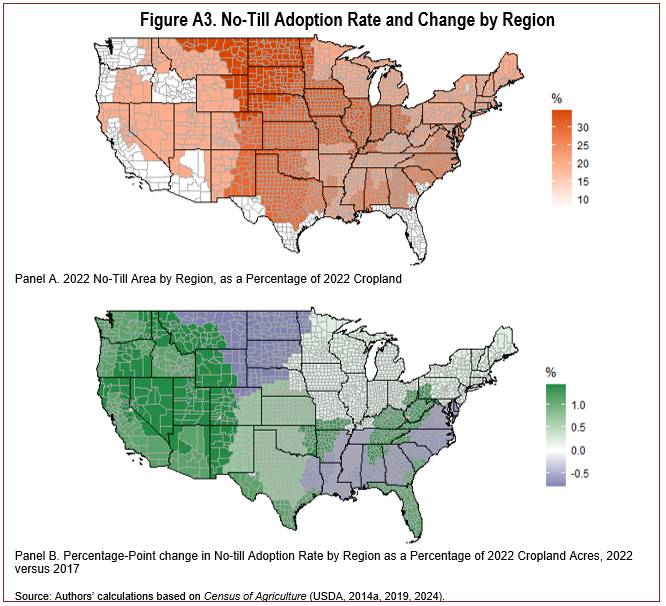
The Northern Great Plains, the Southern Seaboard, and the Mississippi Portal saw a substantial net disadoption of no-till in 2017–2022, equivalent to 26%, 81% and 57% of the expansion in area expansion observed in 2012–2017, respectively. Twenty-three states (Colorado, South Dakota, Michigan, Indiana, Nebraska, Ohio, Georgia, Montana, South Carolina, Oregon, Mississippi, Maryland, Wyoming, Illinois, Tennessee, Delaware, Arizona, Kentucky, Utah, California, North Carolina, Virginia, and West Virginia), jointly experienced a total disadoption of 1.9 million acres in 2017–2022.
The 1,261 counties (44.7% of all counties) that jointly disadopted 10.4 million acres resulted in a stagnating national rate of no-till adoption, which only expanded by 0.2% of the 2022 cropland area between 2017 and 2022. (Table 2). In the absence of disadoption in the counties with net area attrition, the rate of no-till adoption would have been 2.7 percentage points higher at 30.2% of U.S. cropland. Similar to the cover-crop case, the disadoption of no-till has been more widespread and intensive in the 2017–2022 period than over the 2012–2017 period, occurring across 117 extra counties (1,261 versus 1,084 counties) and reducing area by an additional 5.3 million acres (10.4 versus 5.1 million acres).
As is the case for cover crops, no-till adoption decelerated between 2017–2022 and 2012–2017, as demonstrated by the lower percentage changes in net area across all regions in 2017–2022 with respect to the corresponding values for 2012–2022 in Table 2. Further, the deceleration brought stagnation in area at the national level. These observations provide further evidence against the hypothesis that noncontinuous use of conservation practices, or “alternating adoption” (Pannell and Claassen, 2020) might be the main driver of the observed disadoption in this setting and supports the idea that similar to cover crops, farmers are likely to transition from conservation tillage to other systems (Pathak et al., 2024). The potential impact of no-till disadoption on carbon markets is larger than the impact of cover crop disadoption, given that typical rates of carbon sequestration under no-till practice exceed those from cover-crop practices in all farm regions (Plastina,Jo, and Wongpiyabovorn, 2024). Additionally, switching from no-till practices to conventional tillage can generate carbon reversals that undermine the credibility and value of carbon credits generated via carbon farming (Wongpiyabovorn, Plastina, and Crespi, 2022).
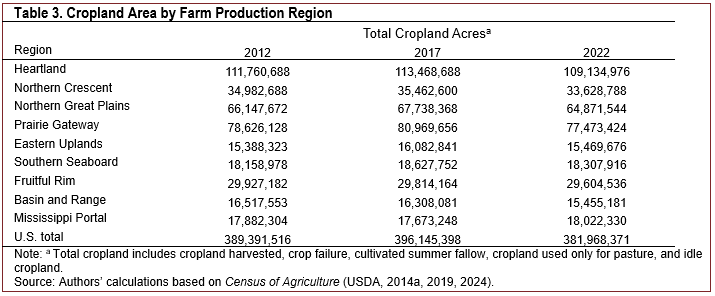
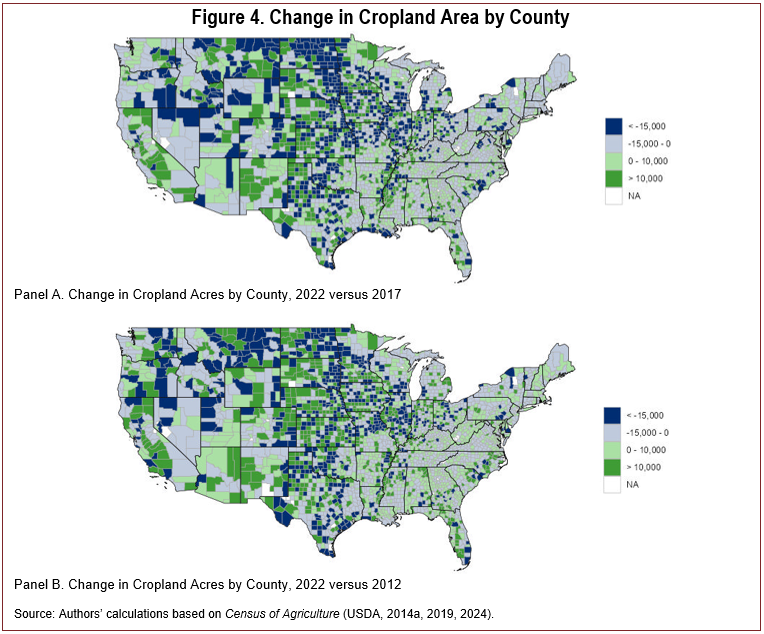
The adoption rates reported above for cover crops and no-till in 2012 and 2017 as a percentage of 2022 cropland area are different than those reported by Sawadgo and Plastina (2022) and expressed as a percentage of 2017 cropland area. The main reason is that cropland area has declined by 14.2 million acres or 3.6% across the 48 contiguous states between 2017 and 2022 (Table 3). The decline in cropland area occurred across 1,865 counties (Figure 4, Panel A) and pushed total cropland area in all farm regions but the Mississippi
Portal to lower levels. The Heartland, the Eastern Uplands, the Northern Great Plains, and the Northern Crescent, which lost 4.3, 3.5, 2.9, and 1.8 million acres, respectively, jointly accounted for 88% of the loss ofnational cropland. Reductions in cropland area were already observed between 2012 and 2017 in the Fruitful Rim, the Basin and Range, and the Mississippi Portal, and jointly accounted for a 0.5-million-acre loss (Figure 4, Panel B). Over the entire decade 2012–2022, only the Eastern Uplands, the Southern Seaboard, and theMississippi Portal saw increases in cropland area, although smaller than 1% of 2012 area levels.
Our analysis provides useful insights on the trends in cover crop and no-till adoption and disadoption at the regional and national levels, raising stimulating questions for future research about the motives behind the observed changes and policy design to optimize the use of public monies to incentivize new adoption of conservation practices versus maintenance of existing ones.

