Commercial banks are the leading lenders of non–real estate debt to farmers, with $72 billion debt (41%) of $174 billion total non–real estate debt, and the second leading lenders of real estate debt, with $109 billion debt (32%) of $345 billion total real estate debt in 2023 (USDA-ERS, 2024). Despite the entry of other lenders into the agricultural lending space, commercial banks have maintained their dominant position. Their widespread network of bank branches allows them to have a physical presence in local communities unmatched by other lenders. This physical presence gives them a deep understanding of the agricultural industry and the risks facing their farm patrons’ operations.
Over the years, there have been changes in the type of commercial banks that extend credit to farmers (Nam, Ellinger, and Katchova, 2007). Increased consolidation has led to a shift in lending volume from smaller to larger banks. This consolidation has been a decades-long trend for the U.S. banking industry. Between 1984 and 2019, the number of federally insured banks in the United States declined from 17,901 to 5,177, an annual decline of about 2% (FDIC, 2020). The same trend can be observed for agricultural banks; from 2010 to 2019 for instance, the number of agricultural banks also declined by about 2% annually.
Several factors, including technological advancement, financial distress, international consolidation, and deregulation, drove consolidation in the banking sector. The easing of restrictions on interstate and intrastate banking in the 1980s and 1990s significantly encouraged voluntary mergers before 2012 (FDIC, 2012). By 2012, most of the failures associated with the financial crisis and Great Recession had occurred (FDIC, 2020). Thus, after 2012, voluntary mergers between unaffiliated institutions became the primary driver of consolidation, leading to a decline in the number of insured depository institutions. The historically low number of new bank charters between 2012 and 2019 further accelerated this trend with agricultural commercial banks being the primary target of mergers and acquisitions during this period (Kim and Katchova, 2022).

Various studies have examined the changes in the volume of agricultural loans from all commercial and agricultural banks (Regmi et al., 2020; Regmi and Featherstone, 2022; Kim and Katchova, 2022). This study builds on previous research to measure structural change by comparing changes in number of banks agricultural loan volume, and market share for different sizes of agricultural and nonagricultural banks and introducing midpoint loan volume as a measure to evaluate the magnitude of structural change. This article uses data from the quarterly call reports (from years 2003–2022) on commercial banks, released by the Federal Financial Institutions Examination Council (FFIEC, 2023). We define a bank’s agricultural loans as the sum of domestic real estate loans secured by farmland and domestic production and other loans to farmers. Banks were classified as agricultural banks if at least 25% of their loans were agricultural loans. This study uses fourth-quarter loan volume as the end-of-year loan volume for each year. The agricultural loan volumes were adjusted for inflation using a gross domestic price deflator from the U.S. Department of Commerce’s Bureau of Economic Analysis, Gross Domestic Product Price Index (BEA API series code: A191RG), to convert nominal loan volume to a real or inflation-adjusted, constant-dollar series. The base year was set to 2023 when adjusting the data for inflation.
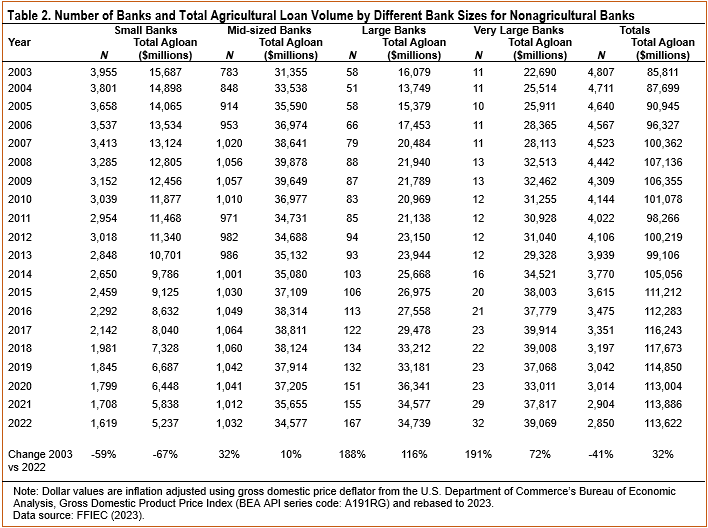
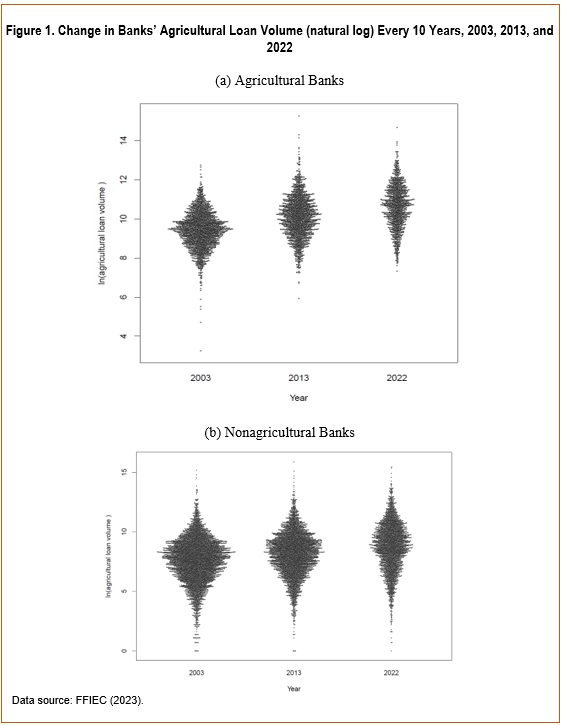
The total number of commercial agricultural and nonagricultural banks that provide agricultural loans to farmers has declined steadily since 2003, by 40% and 41%, respectively (Tables 1 and 2). The decline in the number of banks was more substantial in recent years. To show the decline in the number of banks, we log-transformed individual loan volume from each bank, as the data were highly skewed. Data transformation makes it close to normal for the illustration of the distribution of loan volume. Figure 1 shows the distribution of agricultural loans among agricultural and nonagricultural banks for 2003, 2013, and 2022. In the figure, each data point represents a bank’s loan volume, with the data points on the top representing banks with larger loan volumes and points on the bottom representing banks with smaller loan volumes. A visual comparison of the number of banks in 2003, 2013, and 2022 shows that the largest decline in numbers can be seen on thebottom and mid-section, representing small and mid-sized banks. Figure 1 suggests that the decline occurred more substantially after 2012.
To analyze the changes statistically, we divided the data into four different sizes of banks based on total agricultural loan volume. We ranked both agricultural and nonagricultural banks according to agricultural loan volume, as follows:
For agricultural banks, the number of small and mid-sized banks declined by 83% and 33%, respectively. However, the number of larger banks increased by almost 1,000% (Tables 1 and 2). For nonagricultural banks, only the number of small banks declined, by 59%. The number of mid-sized and larger nonagricultural banks increased by 32% and close to 200%, respectively. Between 2003 and 2022, the magnitude of the decline in the number of small banks and the increase in the number of larger banks was more substantial in agricultural banks compared to nonagricultural banks. This indicates that agricultural banks were more impacted than nonagricultural banks by consolidations and mergers.
Although there has been a significant decrease in the number of banks—mainly due to acquisitions and mergers in banking sectors—total agricultural loan volume has increased substantially since 2003. The agricultural loan volume has increased by 41% for all commercial banks, 32% for nonagricultural banks, and 56% for agricultural banks (Tables 1 and 2). Small and mid-sized agricultural banks experienced an 88% and 25% decline, respectively, in agricultural loan volumes (Table 1). The decline in the number of banks of these sizes was also reflected in the decrease in total agricultural loan volumes. However, the agricultural loan volumes of large and very large agricultural banks increased by about 719% and 865%, respectively, in 2022 compared to 2004 (Table 1). This resulted in an increase in total agricultural loan volume for agricultural banks. Only small nonagricultural banks witnessed a decrease in agricultural loan volume, by 67%, while agricultural loan volume increased by about 10% for mid-sized nonagricultural banks. Large and very large nonagricultural banks saw increases of 116% and 72%, respectively, in agricultural loan volume (Table 2).
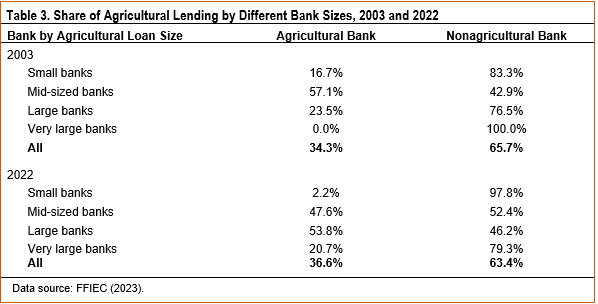
Of the total agricultural loan volumes, nonagricultural banks hold more than 60% of the share of agricultural loan volume. The increase in the number of larger banks and the decline in small and mid-sized banks indicates the consolidation of the smaller banks to the larger banks. This is a major contributor to the increase in the share of the larger banks in total agricultural lending. Table 3 shows that the composition of agricultural banks market share in agricultural lending has declined for small and mid-sized banks and increased for larger banks ($100 million and more in agricultural loan volume) from 2003 to 2022.
The substantial change in the agricultural lending share in agricultural banks was observed for small, large, and very large banks. Large agricultural banks in 2022 provided about 54% of agricultural loans, up 30% from 2003. Though there has been an increase in the marketshare of very large agricultural banks, nonagriculturalbanks remain the primary providers of agricultural loans,accounting for 80% of total agricultural lending in this bank size.
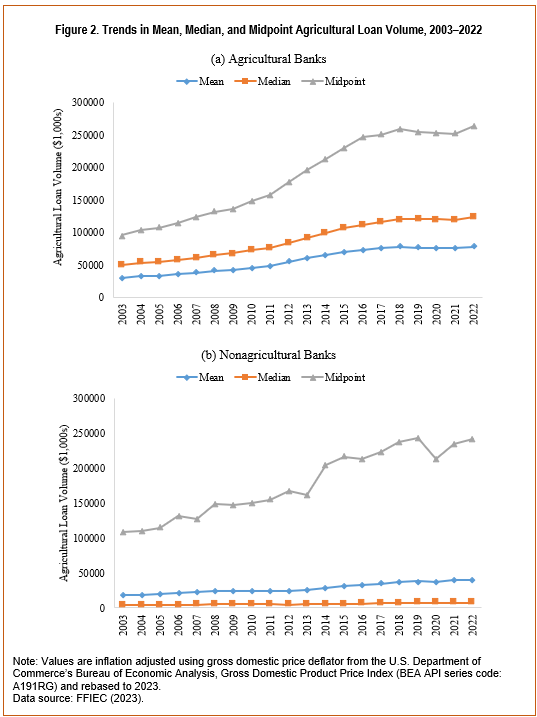
In this study, in addition to mean and median, the midpoint measure was evaluated to measure the magnitude of structural change in agricultural and nonagricultural banks in terms of agricultural loans. Midpoints, also known as weighted medians, are different from simple medians and are calculated by weighing each observation by total. The midpoint loan volume is the loan volume at which half of the total loan volume is for banks with loan volume above the midpoint, and half of the total loan volume is for banks with loan volume below the midpoint. This definition closely follows that of McDonald, Korb, and Hoppe (2013).
We found that the mean and median agricultural loan volumes for agricultural banks increased by about 160% and 120%, respectively, while the midpoint loan volume increased by about 200% in 2022 compared to 2003 (Figure 2a) in inflation-adjusted dollars. The midpoint loan volume also increased about 200% for nonagricultural banks (Figure 2b). The midpoint measure shows that the magnitude of increase in agricultural loan volume was substantial from 2003 to 2022, indicating that the midpoint measure may better capture the magnitude of the change in agricultural loan volume than the traditional measures.
This study examines the trend in the lending landscape of commercial banks in terms of agricultural loans, number of banks, and market share for different sizes of agricultural and nonagricultural banks. Agricultural banks are those that lend over 25% of their loans to the agricultural sector and have a special focus on the agricultural industry. This study shows that small banks (less than $10 million in agricultural loan volume) have seen a decrease in both the number of banks and inagricultural loan volumes, while larger banks ($100 million and more in agricultural loan volume) have seen a dramatic increase in both the number of banks and in agricultural loan volumes in both agricultural and nonagricultural banks. However, the magnitude of the decline in both the number and loan volumes of small and mid-sized banks (less than $100 million agricultural loan volume) and the increase in loan volumes and number of larger banks was substantially higher in agricultural banks. This indicates that agricultural banks could have been the primary targets of mergers and consolidations in the commercial banking sector. The market share of agricultural banks in agricultural lending has declined for small and mid-sized banks and increased for larger banks from 2003 to 2022. The midpoint agricultural loan volume was also substantially higher than the mean and median, indicating that midpoint measures may capture the magnitude of change in agricultural loan volumes over time better than the traditional measures.

