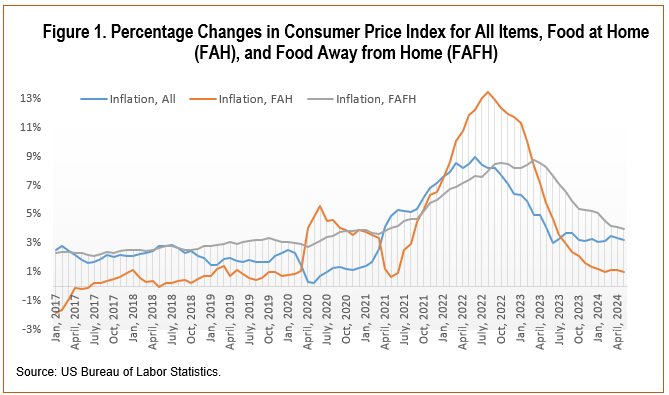
In the United States, the inflation rate hovered around 2% for decades, aligning with the Federal Reserve’s target for a stable economy (US BLS, 2024). However, the disruptions in both demand and supply chains from the COVID-19 pandemic and the Russia–Ukraine conflict led to high levels of inflation, from 4.1% to 9.1%, between April 2021 and May 2023. As shown in Figure 1, food prices were more unstable; for that reason, they are excluded from core inflation calculations (along with energy prices). Specifically, the price index of food at home (FAH) is more volatile compared to that of food away from home (FAFH) and of all items. FAH inflation was minimal and stable at less than or around 1% before experiencing moderate to high fluctuations in 2020 and 2023, peaking at 13.5%.
After this high inflationary period, inflation slowed and returned to moderate levels of around 3%. FAH inflation is even lower, around 1% since November 2023. Despite this cooling trend, more consumers (41%) reported inflation and high cost of living as their most important financial problem in 2024 compared to the past 2 years (35% in 2023, 32% in 2022) (Jones, 2024). In terms of food consumption, consumer agreement on food affordability has been declining over the past 2 years, and over three-quarters expect that inflation will worsen or stay the same (Ellison, Kalaitzandonakes, and Coppess, 2024).
The ongoing concern about inflation can also be observed from a significant gap between actual inflation and perceived inflation, as shown in recent studies. Lebow and Peneva (2024) revealed that households’ perceptions of inflation were roughly in line with actual inflation until actual inflation started trending down; consumers continued to report increasing levels of perceived inflation, which peaked at higher points until it followed the downward trend about 2 months later. Similarly, Balagtas et al., (2024) reported that the perceived food inflation rate remained at around 6% in May 2024, higher than the actual food inflation rate of 2.1% during the same period. The discrepancy between actual inflation and perceived inflation among consumers is approximately 3 percentage points for all items (as of November 2023) and 4 percentage points for food (as of May 2024) (Balagtas et al., 2024; Lebow and Peneva, 2024).
Consumers’ subjective perceptions of inflation and their expectations are critical in their current and future budgeting decisions, which in turn affect the growth of the economy. Therefore, it is imperative to understand the rationale behind consumers’ persistent perceptions of high inflation. Additionally, some consumers mistakenly believe that falling inflation rates will mean falling prices (Gielens, 2023; Peate, 2024). This misconception can lead to confusion when optimistic news about low inflation contrasts with persistently high prices at grocery stores.
In this article, we discuss the potential reasons behind the persistently high consumer perception of FAH inflation even after the actual rate of inflation has slowed. First, we examine the trends in FAH prices and consumer perceptions of grocery pricing over the past 7 years, from January 2017 to May 2024. Second, we discuss several factors that may contribute to the sustained high inflation perception. These include methodologies for measuring inflation, cumulative inflation rates by comparing current Consumer Price Index (CPI) figures to those from before the period of high inflation, and cognitive biases affecting sensitivity to price changes in frequently purchased items like groceries. Our target audience includes households, consumers, and extension agents, with the goal of enhancing understanding of inflation measurements, statistics and related news. By addressing the discrepancy between perceived and actual inflation rates, this article aims to assist the public in interpreting inflation-related statistics more accurately and making more informed budgetary decisions.
In this study, we utilized data from a consumer survey that collected approximately 500 responses per month from primary grocery shoppers in the United States (opt-in panels). The sample represents the U.S. population across demographics such as age and income levels.[1] The survey tracks changes in consumer food consumption patterns alongside their attitudes toward food. Our results are based on 45,984 responses collected between January 2017 and May 2024. We also utilized the Consumer Price Index from the U.S. Bureau of Labor Statistics (BLS).
Consumer inflation perception is measured with the statement “I have noticed an increase in grocery prices at my grocery store recently,” where survey participants answered on a 7-point Likert scale ranging from strongly disagree (1) to strongly agree (7). Consumers have been price-sensitive even when the inflation rate is viewed as low or moderate. The average shares of respondents in each category between 2017 and 2020 were: Disagree (11%), Neutral (15%), Agree (42%), and Strongly Agree (32%). During the high inflationary period between 2021 and 2023, the “strongly agree” category experienced the most significant changes, shifting to 58% on average. Therefore, we focus on the “strongly agree” category in our discussion on inflation perception.
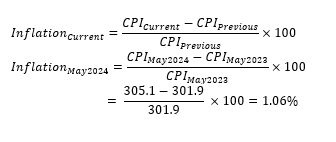
The consumer price index (CPI) tracks the price levels of a standard basket of goods and services over time (US BLS, 2024). Based on the CPI, inflation measures the rate at which the overall level of prices for goods and services rises over time (Federal Reserve Bank of Cleveland, 2024). Inflation is typically measured by comparing the CPI of the current period to that of the same period 1 year earlier. For instance, the published FAH inflation rate for May 2024 was 1.06%, calculated by comparing the CPI of May 2024 to the CPI of May 2023. The 1.06% indicates that the CPI increased by that percentage year over year. Knowing the comparison period, typically 1 year prior, is essential for accurate interpretation of inflation statistics.
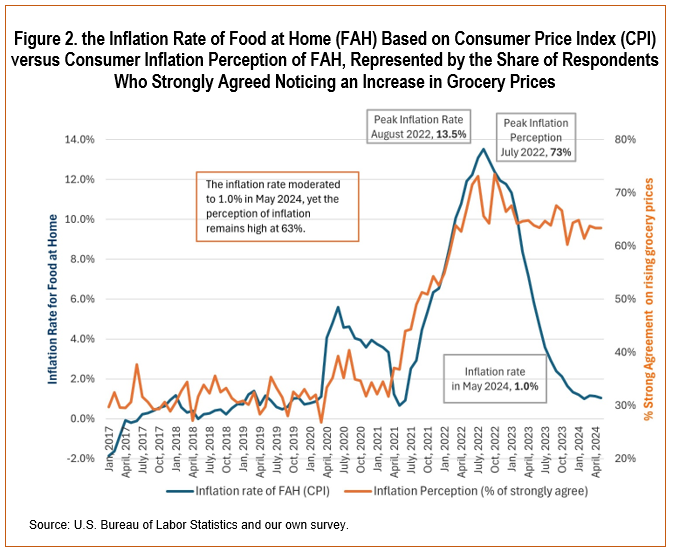
The FAH inflation rate specifically measures the price changes of groceries and food products that consumers purchase for consumption at home. Figure 2 shows FAH inflation rates obtained from the BLS alongside consumer inflation perceptions of FAH obtained from our consumer survey. Inflation perception is represented by the percentage of respondents who strongly agreed that they have noticed an increase in grocery prices. Consumer inflation perception closely aligns with the actual inflation movement (correlation r = 0.72, statistical significance level p < 0.01), with notable exceptions during certain periods, such as the onset of the Covid-19 pandemic and the aftermath of a high inflationary phase. Despite a consistent decline in the actual FAH inflation rates since its peak of 13.5% in August 2022, over 60% of respondents continued to strongly agree that grocery prices are rising.
To gain deeper insight into consumer perceptions of FAH inflation over time, we analyzed the average share of respondents who strongly agreed that grocery prices were increasing during three distinct periods (see Table1). Even before the high inflationary period, consumers were already sensitive to price changes, with 33% of respondents strongly agreeing that they were noticing grocery price increases. During the inflationary period, this percentage rose sharply to 63% on average, reflecting heightened consumer concerns about inflation. However, even as the inflation rate began to decline in the post-inflation period to 1.8% on average, the perception of inflation remained high, averaging 64%.During this period, the correlation between actual FAH inflation rates and inflation perception was no longer significant (r = 0.39, p = 0.23). The sustained high percentage of concerned respondents after the peak highlights the lasting impact of inflation on consumer perceptions.

The discrepancy between the falling actual FAH inflation rates and persistent high inflation perception may be understood by a few of the following factors.
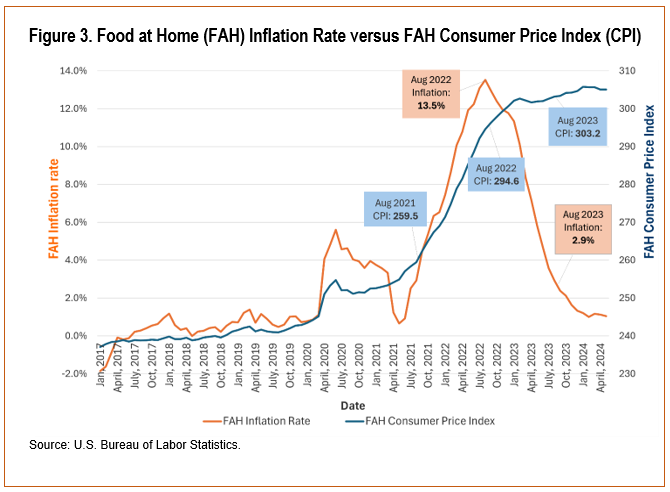
The sustained high inflation perception among consumers is expected, given the presence of continued inflation in the economy. High inflation means that prices are increasing rapidly, while low inflation rates indicate that prices are increasing slowly. Therefore, current moderate inflation indicates that prices of many goods and services have continued to increase even after a significant jump during the high inflationary period, just not as quickly as before. A decreasing inflation rate does not indicate that price levels are falling; it simply means that prices are rising more slowly. This often leads to confusion among consumers, who may misinterpret news about decreasing inflation rates as a decrease in the prices of their basket, as noted in previous studies (Gielens, 2023; Peate, 2024). Disinflation (i.e., a slowdown in the rate of inflation) should not be confused with deflation, which is an actual decrease in the general price (Marks, 2023).Figure 3 illustrates trends in inflation rates alongside the Consumer Price Index (CPI) of food at home, demonstrating that while the inflation rate was declining from 13.5% (August 2022) to 2.9% (August 2023), the CPI has continued to rise, albeit at a slower pace. A lowered inflation rate therefore indicates that prices are still increasing, though at a reduced rate compared to the previous year. The following example highlights how fluctuations in the CPI influence the magnitudes of inflation rates. Over the year from August 2021 to August 2022, the CPI increased significantly, by 35 index points (from 259.5 to 294.6), leading to a peak inflation rate of 13.5% in August 2022. In the following year, from August 2022 to August 2023, the CPI rose by a smaller 8.6 index points (from 294.6 to 303.2), resulting in a lower inflation rate of 2.9% in August 2023. This example demonstrates that significant increases in the CPI correspond to higher inflation rates, and vice versa. Recognizing the ongoing rise in CPI is crucial for understanding the persistently high consumer inflation perception. This insight helps explain why consumers may continue to perceive high inflation in 2023 and2024, by showing the continued high price levels during moderate inflation rates.
The inflation rate is primarily measured using the Consumer Price Index (CPI). As noted earlier, the CPI tracks the average change over time in the prices paid by consumers for a specified basket of goods andservices. It is important to understand that inflation rates measure the average change in prices on an annual basis. However, it is possible for consumers to compare current prices to price levels from periods they are more accustomed to, rather than just the previous year. This tendency can lead to a perception of higher prices and inflation rates that are evidenced by other studies (Balagtas et al., 2024; Lebow and Peneva, 2024).
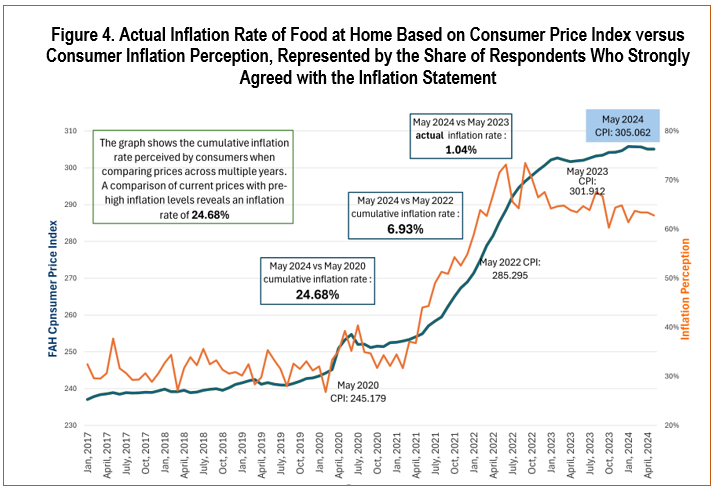
The impact of consumers comparing current prices to those from several years ago can be better understood by examining cumulative inflation rates over various periods (Figure 4). In May 2024, the actual year-over-year inflation rate (i.e., compared to May 2023) was 1.04%. However, when comparing the CPI of May 2024 to 2 years ago (i.e., May 2022), the cumulative inflation rate rises to 6.93%. A comparison between May 2024 and May 2020 (i.e., 4 years ago) reveals a cumulative inflation rate of 24.68%. This analysis highlights how consumers perceive inflation differently depending on the time frame they use for comparisons, even when recent inflation rates are relatively low.
Although food-at-home (FAH) spending makes up a small part of disposable income, its frequent purchase can make people feel more affected by inflation (D’Acunto et al., 2021; Weber et al., 2022). In 2023, FAH spending was 5.3% of disposable income; FAH spending has consistently remained around 5% for the last 20 years (USDA ERS). The average FAH expenditure per person in 2023 was $3,186.95, a 27.7% increase since 2019, similar to the 25.3% rise in FAH inflation during the same period (USDA ERS and BLS, 2024). However, since groceries are essential, consumers tend to give more importance to the prices of frequently purchased items when thinking about inflation. D’Acunto et al. (2021) showed that grocery price changes play a key role in shaping how people view overall inflation, especially because of how often they buy these items.
The survey by Balagtas and Bryant (2024) highlights this trend, revealing that respondents were more sensitive to food prices than to prices in other sectors. Food stood out as the category with the highest percentage ofrespondents reporting price increases over the past 12 months, and it was also identified as the area where consumers felt the most significant price hikes. Interestingly, during the same period, food inflation (2.2%) was actually lower than that of other goods and services, such as housing (4.5%), auto insurance (22.6%), and utilities (3.6%). This cognitive bias leads consumers to overestimate food inflation, even when actual rates are lower. Price changes for everyday essentials like groceries, fuel, and household items are often more noticeable and memorable, compared to less frequently purchased goods and services. Because these essentials are bought more regularly, their price fluctuations tend to stand out, skewing consumers’ overall perception of inflation.
Our study explores the reasons behind the dissonance between falling inflation rates and the persistent high perception of inflation, particularly focusing on FAH prices from January 2017 to May 2024. Despite a significant decline in actual inflation rates, consumers continue to report high levels of perceived inflation. This underscores a complex interplay of economic and contextual factors influencing consumer behavior and sentiment.
A fundamental misunderstanding of how inflation is calculated and what it indicates contributes to the disparity between actual and perceived inflation. In conjunction with this, consumers often compare current prices to those from periods with which they are more familiar, rather than just the previous year. Given the significant price hikes during recent periods of high inflation, current prices—even with lower inflation rates—are often compared to pre-inflation levels, leading to a perception of persistently high prices. Additionally, economic conditions, such as rising federal interest rates, have heightened consumers’ price sensitivity, thereby amplifying the perception of inflation. Compounding this issue, consumers tend to place more weight on price changes in frequently purchased items, such as groceries. This overemphasis overshadows stable prices in other categories, further contributing to the perception of increased inflation.
Understanding these factors is crucial for policy makers and economists aiming to address inflation concerns effectively and targeted policy and communication interventions. Clear communication strategies that educate consumers about the nature of inflation and disinflation can help align perceived inflation with actual inflation rates. Consumers will gain the ability to make better-informed decisions with an increased understanding of the complex dynamics of inflation and its perception, as well as a more accurate understanding of economic conditions. In line with this, further outreach articles are encouraged to provide accessible explanations of socioeconomic situations closely related to consumers and households, enabling them to make well-informed choices.
Balagtas, J., & Bryant, E. 2024. Consumer Food Insights. 3(5). Purdue University Center for Food Demand Analysis and Sustainability. Available online: https://ag.purdue.edu/cfdas/wp-content/uploads/2024/06/Report_202405-1.pdf
Balagtas, J., E. Bryant, B. Ellison, and C. Hubbell. 2024. Consumer Food Insights 3(6). Purdue University Center for Food Demand Analysis and Sustainability. Available online: https://ag.purdue.edu/cfdas/wp-content/uploads/2024/07/Report_202406-1-1.pdf
Chen, L.A., L. House, and X. Bi. 2023. “Food Outlet Choice Patterns of Alternative Food System Consumers.” International Food and Agribusiness Management Review 26(4):729–748.
D’Acunto, F., Malmendier, U., Ospina, J., & Weber, M. 2021. Exposure to Grocery Prices and Inflation Expectations. Journal of Political Economy, 129(5), 1615--1639. https://www.journals.uchicago.edu/doi/epdf/10.1086/713192
Ellison, B., M. Kalaitzandonakes, and J. Coppess. 2024. « Consumers Continue to Struggle with Inflation and Food Affordability: Results from GFAPS.” Farmdoc Daily 14(108).
Federal Reserve Bank of Cleveland. 2024. “What Is Inflation?” Inflation 101. Available online: https://www.clevelandfed.org/center-for-inflation-research/inflation-101/what-is-inflation-start [Accessed September 12, 2024]
Gielens, K. 2023. “Editorial - Striking A Balance: Retailers at the Crossroads of Price and Responsibility.” Journal of Retailing 99(3):319–321.
Jones, J.M. 2024. “Americans Continue to Name Inflation as Top Financial Problem.” Gallup. Available online: https://news.gallup.com/poll/644690/americans-continue-name-inflation-top-financial-problem.aspx
Lebow, D., and E. Peneva. 2024. “Inflation Perceptions During the Covid Pandemic and Recovery.” FEDS Notes. Board of Governors of the Federal Reserve System. Available online: https://www.federalreserve.gov/econres/notes/feds-notes/inflation-perceptions-during-the-covid-pandemic-and-recovery-20240119.html
Marks, C. 2023. “Inflation, Disinflation and Deflation: What Do They All Mean?” Open Vault Blog. Federal Reserve Bank of St. Louis. Available online: https://www.stlouisfed.org/open-vault/2023/august/explaining-inflation-disinflation-deflation
Peate, M.C. 2024. “The Inflation Rate Is Falling, but Prices Are Not.” Page One Economics. Federal Reserve Bank of St. Louis. Available online: https://www.stlouisfed.org/publications/page-one-economics/2024/03/01/the-inflation-rate-is-falling-but-prices-are-not
United States Bureau of Labor Statistics (US BLS). “BLS Data Viewer, All items in U.S. city average, all urban consumers, seasonally adjusted (Series ID: CUSR0000SA0), Food at home in U.S. city average, all urban consumers, seasonally adjusted (Series ID: CUSR0000SAF11), Food away from home in U.S. city average, all urban consumers, seasonally adjusted (Series ID: CUSR0000SEFV)”. Available at: https://data.bls.gov/dataQuery. (Accessed July 1, 2024).
United States Department of Agriculture Economic Research Service (USDA ERS). 2024. Normalized food expenditures by all purchasers and household final users. https://www.ers.usda.gov/data-products/food-expenditure-series/
Weber, M., D’Acunto, F., Gorodnichenko, Y., & Coibion, O. 2022. The Subjective Inflation Expectations of Households and Firms: Measurement, Determinants, and Implications. Journal of Economic Perspectives, 36(3), 157–184. https://doi.org/10.1257/jep.36.3.157

