Over the last 2 decades, blueberries have surged in popularity, marked by a tenfold increase in U.S. blueberry consumption per capita (USDA-ERS, 2023). This remarkable growth is driven by consumers’ demand for healthy foods as blueberries have emerged as a superfruit rich in nutrients and antioxidants (Wergin, 2022). To meet the expanding global demand, several blueberry-producing countries have ramped up their production significantly, with the United States consistently holding a prominent position as a leading blueberry producer. However, the landscape of the U.S. blueberry market has undergone a fundamental shift with the emergence of new global producers (Kramer, 2020).
From 2007 to 2022, U.S. imports of fresh blueberries soared from 77 million to 657 million pounds, exceeding domestic output (USDA-NASS, 2023). The surge of imports has also been observed in other fruit and vegetable sectors (Suh, Guan, and Khachatryan, 2017; Huang, Guan, and Hammami, 2022; Li et al., 2022). Peru and Mexico—benefiting from strategic production timing, trade agreements, lower labor costs, and technological advancements—have become predominant sources of U.S. blueberry imports. This increase in U.S. imports of blueberries has benefited consumers but exerted pressure on domestic producers, raising concerns over the industry’s ability to compete with such foreign competition (Office of the United States Trade Representative, 2020).
This article aims to provide an overview of the blueberry market in depth, emphasizing the challenges the U.S. blueberry industry faces in light of foreign competition and discussing strategic responses to ensure its resilience.
Frequently hailed as a “superfood,” blueberries are packed with a wealth of nutrients, including numerousantioxidants and phytochemicals (Wergin, 2022). Theseelements potentially contribute to safeguarding the body against conditions like heart disease and Type 2 diabetes (Kalt el.al., 2020), providing anti-cancer properties (Miller, Feucht, and Schmid, 2019), supporting digestive well-being, and mitigating inflammations (Lee et.al., 2018). Further, studies indicate that incorporating blueberries into one’s diet on a regular basis could enhance memory function and potentially delay the onset of age-related cognitive decline (Wergin, 2022).
Awareness of blueberry health benefits has triggered a surge in its global demand. From 2002 to 2021, the volume of world blueberries imports witnessed remarkable, 12-fold growth, soaring from 132 million pounds to 1,558 million pounds (Pienaar et al., 2022), which suggests increasing demand and trade flows.
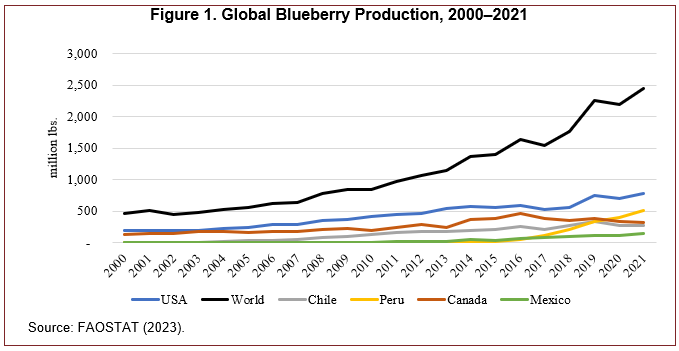
In response to the increasing demand for blueberries, the global blueberry market has witnessed fast growth in supply and a significant shift in market shares. The United States and Canada have experienced a decline in their shares, while emerging producers such as Chile and Peru have achieved a remarkable ascent. As illustrated in Figure 1, total blueberry production in the United States, including both cultivated and wild varieties, was 774 million pounds in 2021, equivalent to 32% of global production, down from 49% in 2010, a 17% reduction in market share. In contrast, Chile, Mexico, and Peru have seen their shares soaring from nearly 0% to 11%, 6%, and 20%, respectively, over the same period (FAOSTAT, 2023).
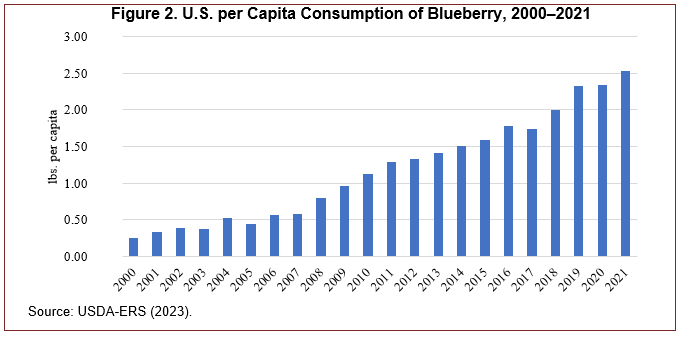
In line with the global trend, the United States is also witnessing an increase in both the consumption and production of blueberries. The growing awareness of the health advantages associated with blueberries has substantially contributed to their rapidly growing consumption. According to FreshPlaza (2023), a large portion of U.S. consumers have identified blueberries astheir favorite fruit. Figure 2 shows the significant growth in per capita blueberry consumption in the United States. Consumption has risen from 0.26 pounds per capita in 2000 to 2.54 pounds per capita in 2021, a tenfold increase. Growth accelerated notably beginning in 2008 and has maintained its pace up to the present.
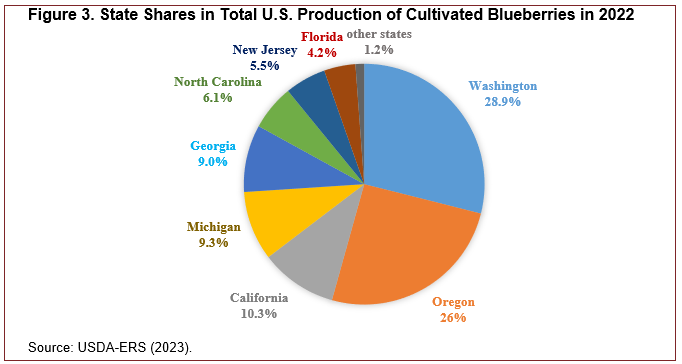
In terms of production, the United States maintains a robust $1.1 billion industry, with its cultivated (tame) blueberry production reaching a notable 621.6 million pounds in 2022, a substantial increase from 493.8million pounds in 2010 (USDA-ERS, 2023). In the U.S. blueberry industry, the Pacific Northwest states of Oregon and Washington lead production, jointly accounting for nearly 55% of the national total (Figure 3), thanks to their favorable climate in the production season spanning from July to September. In 2022, Washington produced approximately 180 million pounds (29%), while Oregon contributed around 160 million pounds (26%). California, with a season extending from May to July, made a significant contribution of 65 million pounds. Following closely, Georgia emerges as a substantial player between June and August,contributing 60 million pounds. Michigan stands out for its highbush blueberry production, occurring from mid-July
to mid-September, yielding approximately 58 million pounds. Continuing down the list, North Carolina
and New Jersey contributed 38 million pounds and 35 million pounds, respectively, between June and August. In 2022, Florida ranked eighth nationally, contributing 26 million pounds between March and May (USDA-AMS, 2023; USDA-ERS, 2023).
Blueberries are utilized in both fresh markets and the processing industry, with the split varying by state. Notably, Florida sells 99% of its production to the fresh market sector. California, New Jersey, and North Carolina allocate a significant 80% of their blueberry production for fresh sales. Georgia closely follows with65%, while Michigan designates 50% of its production for fresh markets, and Washington only sells around 30% to the fresh market (USDA-ERS, 2023).
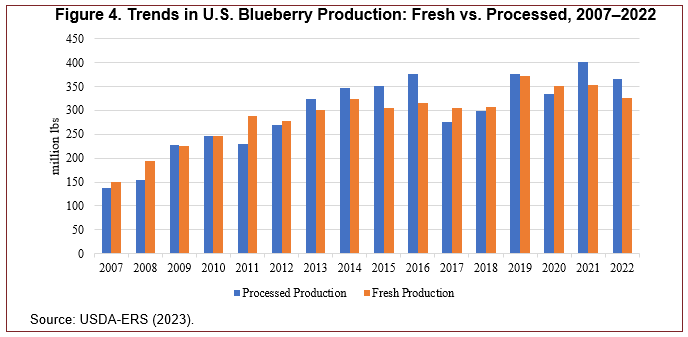
Processed blueberries find common use in products like jams, jellies, and baked goods. Both categories contribute significantly to the overall U.S. production. Figure 4 shows that the shares between fresh and processed have remained approximately equal over the past 15 years. The processed has a slight edge over the fresh in more recent years, which is likely due to increasing imports of fresh blueberries in the U.S. market.
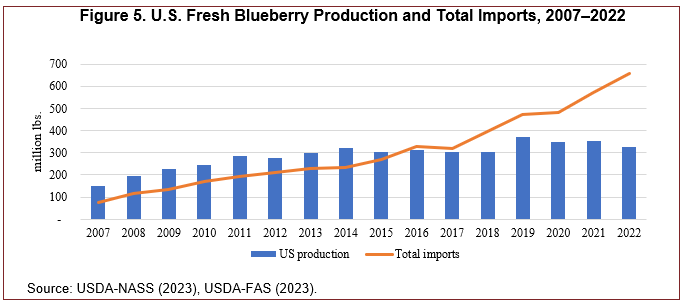
U.S. fresh blueberry production saw a notable expansion before 2014 (Figure 5). Production doubled from 150million pounds in 2007 to 324 million pounds by 2014.However, this surge in production came to a halt and has generally stagnated since 2014. Imports of fresh blueberries experienced fast growth, jumping from 77 million pounds in 2007 to 657 million pounds in 2022—twice the total U.S. production in the same year. Asignificant turning point emerged in 2016, when U.S.fresh blueberry imports exceeded the entire domestic production. By 2022, as much as 90% of U.S. fresh blueberry imports were from only three sources: Peru (49%), Mexico (22%), and Chile (19%). This rapid growth in imports, particularly from Peru and Mexico,has caused substantial challenges to the U.S. domestic industry.
Blueberry production in the northern and northwestern states—such as Michigan, Washington, and Oregon—reaches its peak during the late summer months, aligning with the market window of Peruvian blueberries (mid-August to mid-February). This overlap results in fierce competition. Michigan, a prime example of these northern states, previously held the top position in U.S. fresh blueberry production until it was overtaken by Oregon, Washington, and—notably—by imports from Peru in 2018.
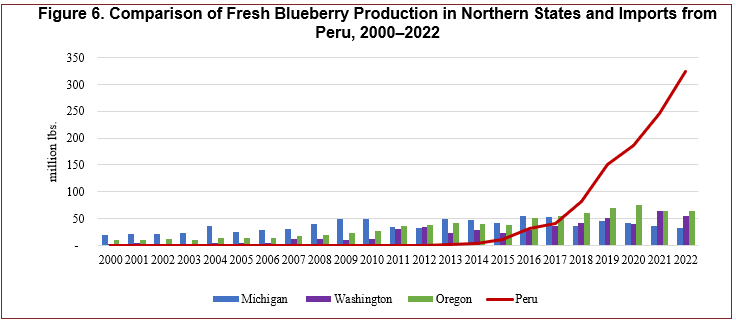
Figure 6 compares northern states’ fresh blueberry production and imports from Peru. After surpassing Michigan in 2018, Oregon and Washington maintained their lead in terms of production. Michigan’s fresh blueberry production increased from 19 million pounds to 49 million pounds in 2009. After experiencing a dip in 2011 and 2012, production rebounded and reached its peak at 55 million pounds in 2016. However, fresh blueberry production in Michigan gradually declined, hitting a low of 32 million pounds in2022, a 43% reduction from the peak only a few years earlier.
This decline coincided with the rapid surge ofimports from Peru. Prior to 2015, imports from Peru were almost nonexistent. Starting in 2015, imports gained momentum and achieved exponential growth in subsequent years, ultimately reaching an impressive 323 million pounds in 2022, ten times higher than Michigan production. The swift increase in Peruvian imports posed significant challenges for Michigan growers.
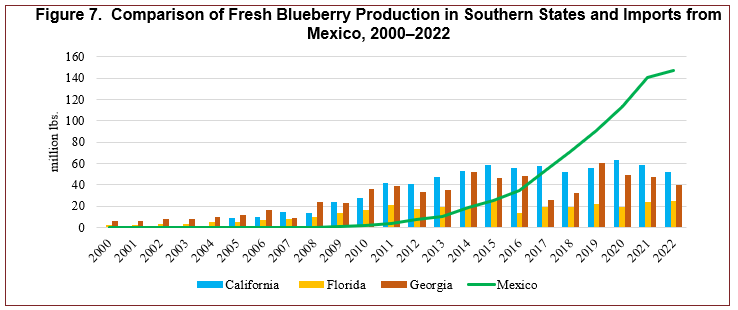
The Sunbelt and Southwest regions, encompassing states like Florida, Georgia, and California, benefit from favorable climates in early seasons of production before other parts of the country. However, emerging imports, particularly those from Mexico, are intensifying competition (Wu and Guan, 2021). Figure 7 presents California, Florida, and Georgia’s fresh blueberry production compared to the U.S. imports of blueberries from Mexico. Although the production in the southern states increased from 2000 to 2015, it has remained stagnant since 2015, coinciding with the significant increase in Mexican fresh blueberry shipments.
In the blueberry market, Mexico is the second-largest source of imports to the United States. It produces blueberries over an extended season spanning from September to June, overlapping with the marketwindows of the southern states (Huang, Guan, andHammami, 2022). This places Mexico in direct competition with Florida, which historically enjoyed premium prices during its early season from March to May with limited competition. However, this landscape started to shift when imports from Mexico began to surge dramatically about a decade ago, skyrocketing from less than a million pounds in 2009 to 147 million pounds in2022, leaving Florida’s blueberry production struggling with stagnant production and decreasing prices.
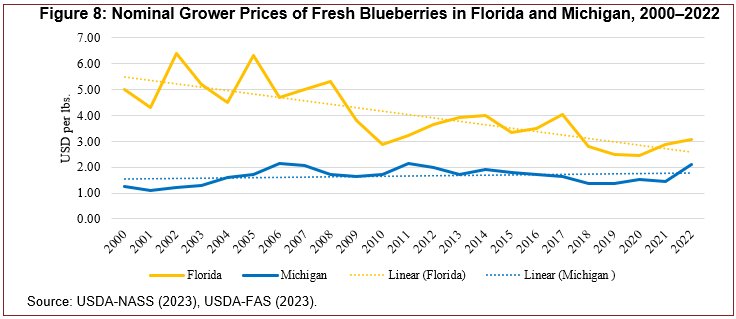
Michigan and Florida serve as prime examples of the way in which fresh blueberry production in northern and southern states has been impacted by the surging imports. Michigan, the leading northern producer of fresh blueberries, has experienced the steepest decline since the ascendance of Peruvian shipments. Florida, a Southern state, competes directly with Mexico with an overlapping production window. Figure 8 illustrates the trends in nominal grower prices of fresh blueberries in Florida and Michigan from 2000 to 2022. Florida’s fresh blueberry nominal grower prices exhibited large swings over the past 2 decades, showing a steep downward trajectory, starting from the peak of $6.40 per pound in 2002 to $2.43 in 2020 (increased to $3.05 in 2022 due to the post-pandemic inflation). During the past 20 years (2002–2022), the nominal (current) price dropped by 52%. Further accounting for inflation, the real price dropped by as much as 71%.
Michigan’s nominal grower prices for fresh blueberries began to increase in the early 2000s, starting at $1.09 in 2001 and peaking at $2.15 in 2006. Since then, prices have fluctuated, generally on a declining trend, reaching a low of $1.35 in 2019 before the Covid-19 pandemic. In 2022, Michigan prices rose to $2.10 from $1.45 in the previous year amid inflationary pressures. Although the nominal price trended up slightly between 2000 and 2022, the real price declined after accounting for 70% inflation over the period.
Recent studies, including those by Muhammad and Countryman (2021) and Soto-Caro et al. (2023), reveal that the decline in domestic prices in the U.S. market is partly attributed to mounting pressure from surging imports. This decreasing price significantly affects the revenues of blueberry growers, who are already grappling with inflation in production costs (Ali, 2022; Goodwin, 2022) and labor shortages (Ali, 2022; Huang et al., 2024), compounded by minimum wage increases in several producing states, particularly Floridaand California (National Agricultural Law Center, 2022). The surge in imports in the U.S. blueberry market adds to the challenges faced by the industry, reflecting similar pressures experienced by other fruit and vegetable sectors in the U.S. Sunbelt region (Wu, Guan, and Whidden, 2016; Biswas, Guan, and Wu, 2018; Guan, Biswas, and Wu, 2018).
While the United States maintains a strong position in blueberry production, shifts in the global market have brought emerging producers like Peru and Mexico to the forefront. These countries have become largest sources of the U.S. imports. Peru strategically capitalizes on its favorable production window, peaking during the Northern Hemisphere’s winter months, allowing it to align with major importers in the Northern Hemisphere. This position has been further fortified by the U.S.–Peru Free Trade Agreement (PTPA), established in 2009. The country imports genetically improved in-vitro plants from the United States and subsequently exports 55% of its blueberry production back to the United States, enjoying tariff-free benefits (Camacho, 2023). Over the past decade, Peru’s blueberry sector has earned a reputation as an innovative, dependable, and top-quality supplier to global markets. Recognizing this success, the Peruviangovernment formally designated berries as a strategic national crop that will receive targeted government initiatives aimed at enhancing exports (Camacho, 2023).
Meanwhile, Mexico, benefiting from lower labor costs (Wu, Guan, and Garcia-Nazariega, 2018) andpropelled by the adoption of new technologies and favorable government policies (Wu, Soto-Caro, and Guan, 2021), has become the largest source of U.S. imports of fresh produce (Huang, Guan, and Hammami, 2022).
The U.S. blueberry industry has taken collaborative efforts to address the issue of surging foreign competition. Led by growers’ organizations in Florida, Georgia, and Michigan, the U.S. blueberry industry has campaigned to seek trade remedies in response to the surging imports and discovery of Mexican government subsidies (Wu et al., 2018, Wu, Soto-Caro, and Guan, 2021). In October 2020, upon the request from the Office of the U.S. Trade Representative (USTR), the U.S. International Trade Commission (USITC) initiated a global safeguard investigation under the provisions of Section 201 of the Trade Act of 1974 to assess the injury caused by imports, using data up to 2019. However, the USITC concluded in February 2021 that increased imports were not “a substantial cause of serious injury, or the threat of serious injury” to the domestic industry (USITC, 2021).
The latest market trend suggests that the impact assessment might need to be updated. Rising imports of blueberries create downward pressure on prices in the U.S. blueberry market (Kramer, Simnitt, and Calvin, 2020). To counteract this trend, policy makers and industry stakeholders could consider policies and strategies that promote research and development for mechanization and genetics to enhance productivity and mitigate production costs. This would improve the competitiveness of the industry and ensure its resilience in the face of increasing foreign competition.
Ali, S.S. 2022, September 5. “Farmers Push for Immigration Reform to Counter Labor Shortages and Rising Food Prices.” NBC News. Available online: https://www.nbcnews.com/news/us-news/farmers-pushing-immigration-reform-counter-labor-shortages-escalating-rcna45741 [Retrieved 03/05/2024].
Biswas, T., Z. Guan, and F. Wu. 2018. “An Overview of the U.S. Bell Pepper Industry.” Publication FE1028. Gainesville, FL: Food and Resource Economics Department and UF/IFAS Extension.
Camacho, M. 2023. Blueberry Annual Voluntary. Washington, DC: USDA Foreign Agricultural Service (USDA-FAS), Report PE2023-0002. Available online: https://apps.fas.usda.gov/newgainapi/api/Report/DownloadReportByFileName?fileName=Blueberry Annual Voluntary_Lima_Peru_PE2023-0002.pdf [Retrieved 10/05/2023].
FAOSTAT. 2023. Available online: https://www.fao.org/faostat/en/#home [Retrieved 09/18/2023].
FreshPlaza. 2023, May 12. “Global Market Overview Blueberries.” Available online: https://www.freshplaza.com/africa/article/9528520/global-market-overview-blueberries/ [Retrieved 10/05/2023].
Goodwin, K. 2022, June 7. “Farmer Sentiment Plummets as Production Costs Skyrocket” [press release]. Purdue University and CME Group. Available online: https://www.purdue.edu/newsroom/releases/2022/Q2/farmer-sentiment-plummets-as-production-costs-skyrocket.html [Retrieved 03/05/2024].
Guan, Z., T. Biswas, and F. Wu. 2018. “The US Tomato Industry: An Overview of Production and Trade. Publication FE1027. Gainesville, FL: Food and Resource Economics Department and UF/IFAS Extension.
Huang, K.M., D. Farnsworth, Z. Guan, and Y. Li. 2024. “E-Verify and Its Implications for US Agriculture.” Choices 39(1).
Huang, K.M., Z. Guan, and A. Hammami. 2022. “The US Fresh Fruit and Vegetable Industry: An Overview of Production and Trade. Agriculture 12(10):1719.
Kalt, W., A. Cassidy, L.R. Howard, R. Krikorian, A.J. Stull, F. Tremblay, and R. Zamora-Ros. 2020. “Recent Research on the Health Benefits of Blueberries and Their Anthocyanins.” Advances in Nutrition 11(2):224–236.
Kramer, J. 2020. “Fresh Blueberry Supplies Expand as U. S. Consumers Develop a Taste for Year-Round Blueberries.” Amber Waves.
Kramer, J., S. Simnitt, and L. Calvin. 2020. Fruit and Tree Nuts Outlook: September 2020. U.S. Department of Agriculture, Economic Research Service: FTS371, September.
Lee, S., K.I. Keirsey, R. Kirkland, Z.I. Grunewald, J.G. Fischer, and C.B. de La Serre. 2018. “Blueberry Supplementation Influences the Gut Microbiota, Inflammation, and Insulin Resistance in High-Fat-Diet–Fed Rats.” Journal of Nutrition 148(2):209–219.
Li, S., F. Wu, Z. Guan, and T. Luo. 2022. “How Trade Affects the US Produce Industry: The Case of Fresh Tomatoes.” International Food and Agribusiness Management Review 25(1):121–133.
Miller, K., W. Feucht, and M. Schmid. 2019. “Bioactive Compounds of Strawberry and Blueberry and Their Potential Health Effects Based on Human Intervention Studies: A Brief Overview. Nutrients 11(7):1510.
Muhammad, A., and A.M. Countryman. 2021. “Safeguard Measures and Fresh Produce Trade: The Case of US Blueberry Imports.” Q Open 1(2):qoab018.
National Agricultural Law Center (2022). “Minimum Wage for Agricultural Workers.” Available online: https://nationalaglawcenter.org/state-compilations/agpay/minimumwage/ [Retrieved 02/03/2024].
Office of the U.S. Trade Representative. 2020. “Report on Seasonal and Perishable Products in U.S. Commerce.” Joint Report: USTR, U.S. Department of Agriculture, and U.S. Department of Commerce. Available online: https://ustr.gov/sites/default/files/files/reports/2020/ReportSeasonalPerishableProductsUSCommerce.pdf.
Pienaar, L., P. Smit, J. Hattingh, and K. Cloete. 2022. “Developing economic models for South African blueberry industry: Outlook 2022-2031.” Report Commissioned by BerriesZA. Paarl: Bureau for Food and Agricultural Policy (BFAP). Available online: https://www.researchgate.net/publication/362593338_Developing_Economic_Models_for_South_Africa%27s_Blueberry_Industry_Baseline_for_2022-2031.
Sotoâ€Caro, A., F. Wu, T. Xia, and Z. Guan. 2023. “Demand Analysis with Structural Changes: Model and Application to the US Blueberry Market.” Agribusiness 39(4):1100–1116.
Suh, D.H., Z. Guan, and H. Khachatryan. 2017. “The Impact of Mexican Competition on the US Strawberry Industry.” International Food and Agribusiness Management Review 20(4):591–604.
USDA Agricultural Marketing Service (USDA-AMS). 2023. AMS Market News. Available online at: https://www.marketnews.usda.gov/ [Retrieved 08/13/2023].
USDA Economic Research Service (USDA-ERS). 2023. Fruit and Tree Nuts Yearbook Tables. Available online: https://www.ers.usda.gov/data-products/fruit-and-tree-nuts-data/fruit-and-tree-nuts-yearbook-tables/ [Retrieved 08/11/2023].
USDA Foreign Agricultural Service (USDA-FAS). 2023. Global Agricultural Trade System Database. Available online: https://apps.fas.usda.gov/gats/default.aspx [Retrieved 08/12/2023].
USDA National Agricultural Statistical Service (USDA-NASS). 2023. Noncitrus Fruits and Nuts. 2015–2022 Summary. Available online: https://usda.library.cornell.edu/concern/publications/zs25x846c
US International Trade Commission (USITC). 2021. “Increased Imports of Fresh, Chilled, or Frozen Blueberries Do Not Seriously Injure U.S. Industry, USITC Determines.” News Release 21-022. Available online: https://www.usitc.gov/press_room/news_release/2021/er0211ll1722.htm [Retrieved 10/05/2023].
Wergin, A. 2022. “The Power of Blueberries.” Mayo Clinic Health System. Available online: https://www.mayoclinichealthsystem.org/hometown-health/speaking-of-health/the-power-of-blueberries [Retrieved 09/26/2023].
Wu, F., and Z. Guan. 2021. “An Overview of the Mexican Blueberry Industry.” Publication FE1106. Gainesville, FL: Food and Resource Economics Department and UF/IFAS Extension.
Wu, F., Z. Guan, and M. Garcia-Nazariega. 2018. “Comparison of Labor Costs between Florida and Mexican Strawberry Industries.” Publication FE1023. Gainesville, FL: Food and Resource Economics Department and UF/IFAS Extension.
Wu, F., Z. Guan, and A. Whidden. 2016. “An Overview of the US and Mexico Strawberry Industries.” Publication FE971/FE971. Gainesville, FL: Food and Resource Economics Department and UF/IFAS Extension.
Wu, F., B. Qushim, M. Calle, and Z. Guan. 2018. “Government Support in Mexican Agriculture." Choices 33(3):1–11.
Wu, F., A. Soto-Caro, and Z. Guan. 2021. “Government Support in Mexican Agriculture: The Program of Agri-Food Productivity and Competitiveness.” Publication FE1107. Gainesville, FL: Food and Resource Economics Department and UF/IFAS Extension.

