Debates about the merits and demerits of farm policy frequently reemerge when a new farm bill is created or when economic conditions prompt lawmakers to contend with growing budget deficits. We are currently in the midst of both events: a new farm bill will be created in 2012 and concerns over the deficit are higher now than any time in recent history. On one side of the farm bill debate are a majority of professional economists who believe that U. S. agricultural subsidies should be eliminated (Mankiw, 2009). Yet, on the other side, the public and farm lobbying groups favor government subsidization of farmers (Ellison, Lusk, and Briggeman, 2010). Growing budget concerns have prompted the Obama Administration to express support for cutting direct payments to large agricultural producers who make more than $500,000 in annual sales revenue, reducing crop insurance subsidies, and eliminating cotton storage credits. It is argued that funding should be targeted to family farms rather than “corporate megafarms” (OMB, 2009).
In addition to arguments about the level of overall support, debate is also occurring on how the U.S. Department of Agriculture (USDA) budget should be allocated among different categories. For example, where budget cuts to “megafarms” have been called for, there is increased support for funding nutritional programs, rural development, and conservation programs (OMB, 2009; Greenstein and Rosenbaum, 2007). Popular writers such as Michael Pollan (2008) have called for drastic reorganizations of food and farm policy, and argue for large shifts in the allocation of funding for food and farms while farm lobbying organization often point out the relatively small (20%) share of the farm bill budget devoted to direct farm support.
Farm, food, and environmental lobbying organizations would of course prefer a larger share of the USDA budget be directed toward their particular interests. And, these interest groups often have a significant impact on the outcomes of farm policy.
The reason is that the groups are smaller, more efficient, and better organized compared to some larger, more diffuse groups such as the general electorate, who in aggregate bear the primary costs of the policy despite the fact the cost per individual is small. To be sure, politics, in part, determine ultimate budget allocations, but what does the average taxpayer prefer? The purpose of this paper is to provide information on what the citizenry desires, which most would argue that at some level should be relevant to farm policy debate. We do not argue the average taxpayer is particularly well informed about agricultural policy. However, one need not be perfectly informed to have a preference. Moreover, we do not assert taxpayer preferences should necessarily be used to set farm policy. We only describe what consumers say they want in terms of the USDA budget allocation. While these data will likely be useful to those engaged in policy debates we maintain a neutral position about what they imply for how farm policy should be set.
As previously mentioned, recent research shows that most taxpayers are sympathetic to the plight of the American farmer. However, Alston (2009) showed that farm support programs are not always efficient; farmers only receive a proportion of every dollar spent on farm subsidies. Alston (2009) estimates that farmers—considered as landowners and suppliers of other farming inputs such as labor—receive about 50 cents of every farm subsidy dollar. By contrast, he estimated that every dollar spent on agricultural research and development would generate a $10 benefit to farmers. Thus, according to Alston’s (2009) estimates, if the desire is to convey $10 billion in benefits to farmers, the outcome could be achieved either by spending $20 billion on farm support programs or by spending $1 billion on agricultural research. These results show that even if taxpayers are willing to direct their tax dollars to benefit farmers, they might be willing to redistribute money away from farm programs and toward agricultural research. Of course, whether taxpayers actually understand this link and are willing to make such trade–offs is ultimately an empirical question, and one we address in this research.
In this paper, we report results from a nationwide survey conducted to determine taxpayer preferences for the various programs supported by the USDA. More specifically, we determined preferences for and the substitutability between the major USDA programs.
A web-based survey was created and administered through Knowledge Networks (KN) in July, 2009. The KN panel is the only existing online panel that has a true probability-based sample of the U.S. population (for more information, visit http://www.knowledgenetworks.com/ganp/). A survey was sent to 1,833 individuals in the KN panel 1,196 of whom completed the survey, implying a response rate of 65%. The survey consisted of approximately twenty questions and took participants, on average, about 10 minutes to complete.
Here, we report results from the initial two questions asked in the survey. Each respondent was first asked “Which category of the United States Department of Agriculture (USDA) spending do you believe is most important?” Respondents were presented with a list of the six budget categories—farm support, food assistance, food safety and inspection, natural resources and environment, research and education, and rural development—along with a brief description of the types of programs falling under each category. For example, under the farm support category, participants were informed that this category “includes farm and commodity programs (direct payments, price supports), crop insurance fund, etc.” For some categories, such as food safety and inspection and natural resources, there is a broad array of programs, so we opted to list some of the main agencies receiving funding in these areas. In the case of natural resources and environment, we informed respondents this “includes Natural Resource Conservation Service, National Forest System, etc.”
| USDA Budget Category | Actual 2008 USDA Budget Allocation | Mean Allocation with Budget Informationa | Mean Allocation without Budget Information |
| Farm Support – includes farm and commodity programs (direct payments, price supports), crop insurance fund, etc. | $22.03 | $17.94 (16.72)b | $15.82 (14.62) |
| Food Assistance – includes Food Stamp Program, Women, Infants, and Children (WIC), School Lunch Program, etc. | $60.40 | $28.43 (21.53) | $20.54 (18.91) |
| Food Safety and Inspection – includes Food Safety and Inspection Service, Animal, Plant, and Grain Inspection, etc. | $3.14 | $24.72 (21.13) | $30.07 (20.3) |
| Natural Resources and Environment – includes Natural Resource Conservation Service, National Forest System, etc. | $8.27 | $11.61 (10.77) | $13.06 (10.6) |
| Research and Education – includes Agriculture Research Service, cooperative state research, education, and extension, etc. | $2.97 | $9.04 (8.55) | $11.44 (8.94) |
| Rural Development – includes loans and grants for rural utilities, housing, and businesses | $3.19 | $8.25 (9.3) | $9.08 (9.85) |
| Number of Observations | 591 | 605 |
Note: The exact phrasing of the question was, "Suppose the USDA gave you $100 to divide among its six budget categories. How much money would you give to each budget category? (If you would not give money to a certain category, please place a zero (0) in its box."
aThe information given to respondents was included in the question itself. For example, the farm support category read, “Farm Support – includes farm and commodity programs (direct payments, price supports), crop insurance fund, etc. (Currently receives approximately $22.03 out of every $100 spent)."
bNumbers in parentheses are standard deviations
It is important to note that overlaps do exist between the USDA and other governmental agencies. For instance, both the USDA and Food and Drug Administration (FDA) have functions pertaining to the regulation of food safety. Likewise, the USDA and Environmental Protection Agency (EPA) both fund conservation efforts. We did not inform respondents of these overlapping relationships, nor did we ask whether they were aware of other government agency activities outside of the USDA for brevity purposes.
Second, respondents were asked how they would distribute the USDA budget across the aforementioned six budget categories if given the chance. Study participants were given the following scenario, “Suppose the USDA gave you $100 to divide among its six budget categories. How much money would you give to each budget category? (If you would not give money to a certain category, please place a zero (0) in its box).” Respondents were prompted if their responses did not add up to $100.
All respondents were asked to answer this question; however, they were randomly assigned to one of two information treatments. In one treatment, subjects were simply given the name and brief description of each of the six categories, and were asked to allocate the $100 to each category. The second treatment was identical to the first except, in addition to the budget category description, they were also told how the USDA currently allocates its budget. For example, food assistance, was described with the phrase, “includes the Food Stamp Program, Women, Infants and Children (WIC), School Lunch Program, etc.,” and then in this information treatment we add in parentheses that food assistance “currently receives approximately $60.40 out of every $100 spent.”
Table 1 shows the exact phrasing of the category descriptions given to respondents in the two questions. Undoubtedly, participants could have been provided more information about individual programs. We chose to present brief descriptions of each program. The USDA has 17 agencies with multiple programs under each agency, so processing information on the costs and benefits of each individual program would likely be a cumbersome task for the majority of participants had we tried to provide more comprehensive explanations for each category.
Using respondents’ allocations, we analyzed people’s preferences for the services and outcomes generated from expenditures for each of the six categories. This also allowed for the calculation of the rate at which an individual was willing to give up one good in exchange for another, holding everything else constant, between budget categories.
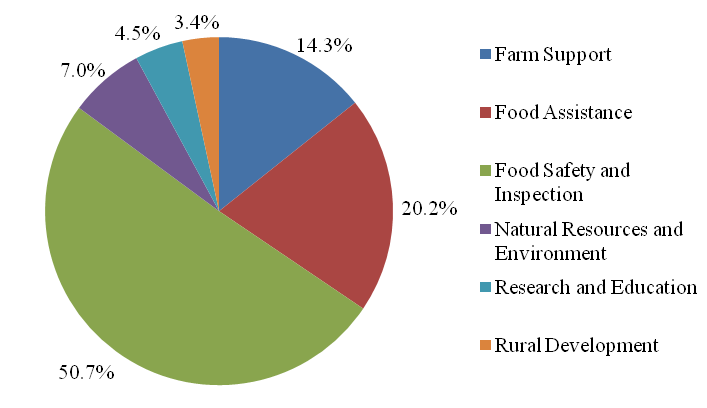
Figure 1 shows the percentage of respondents indicating each of the six budget categories as most important. Over half of respondents (50.7%) believed food safety and inspection expenditures to be the most important component of the USDA budget. This finding is interesting in light of the fact that food safety and inspection ranks second lowest out of the six categories in terms of current funding levels, as it only receives $3.14 out of every $100 spent by the USDA. After food safety and inspection, food assistance was preferred most often by respondents—20.2% believed it to be most important. The budget category receiving the least amount of support was rural development; only 3.4% believed this to be the most important USDA expenditure.
In the second survey question, respondents were asked how they would divide $100 between the six USDA budget components. Table 1 reports the average allocations made in each of the information treatments, along with the actual 2008 USDA budget allocation. On average, respondents assigned the highest budget allocations to food assistance and to food safety and inspection. Although information had a significant influence on the assigned allocations, it did not change the relative ranking across categories except with respect to expenditures on food assistance and food safety. Without information people assigned a higher budget share to food safety than to food assistance ($30.07 vs. $20.54), but with information on current USDA expenditures, people assigned a lower budget share to food safety than to food assistance ($24.72 vs. $28.43). Interestingly, regardless of information treatment, respondents, on average, allocated far fewer dollars to food assistance compared to the current USDA allocation. In 2008, the USDA allocated $60.40 out of every $100 to food assistance, but on average people with (without) this information would prefer to allocate only $28.43 ($20.54) to this category. The high budget shares allocated to food safety and inspection correspond well to the data reported in Table 1, and indicate this is an important category to participants. After food assistance and food safety and inspection, farm support was, on average, assigned the third highest level of funding: $15.82 without information and $17.94 with information. Categories receiving the lowest allocations were natural resources and environment, research and education, and rural development. While the USDA only allocates about $3.00 out of every $100 to research and education and to rural development, our study participants gave each of these categories at least $8.00.
Looking at the overall actual distribution of funds in Table 1, we see that the USDA commits over 80% of its funding to farm support and food assistance, leaving less than 20% to divide among the other four budget components. In contrast, our sample respondents, on average, preferred a more even distribution of funds. Current USDA spending on the six categories varied from $2.97 to $60.40, for a range of $57.43, while the range of mean allocations from the two information treatments are both about $20. This finding is especially noteworthy for the group receiving additional information on the current budget allocation. Despite knowledge of the actual USDA spending, their preference was to provide a more even allocation of funds. However, it should be noted that even though the average allocations are more equal across categories, at the individual level there was significant dispersion with some people allocating all $100 to one category such as food safety or farm support programs.
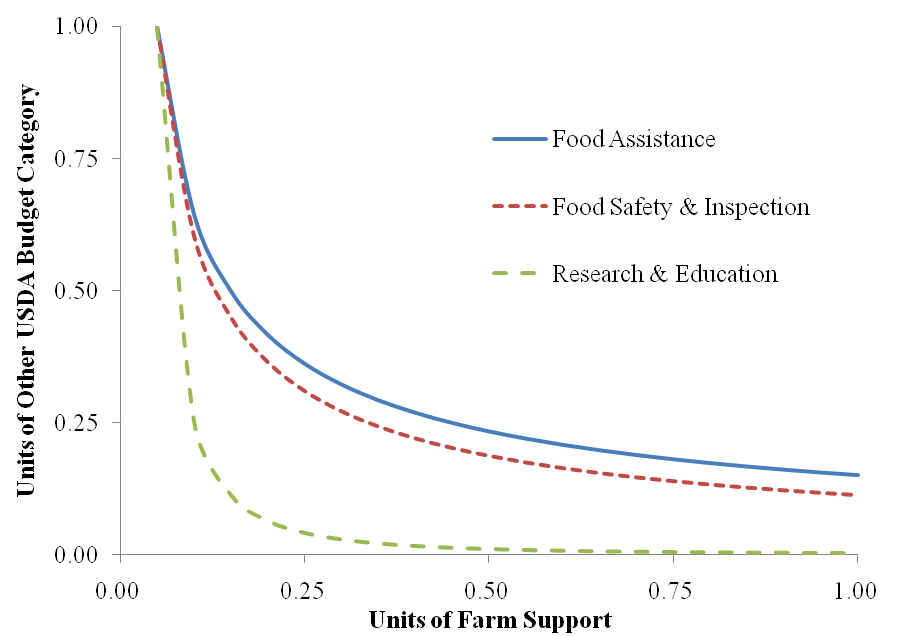
Figure 2 illustrates the implied trade–off between farm support programs and between food assistance, food safety, and research and education. It shows all combinations of the levels of spending on two budget categories with which the average survey respondent is equally happy. This gives an idea of the implied trade–offs people were willing to make between programs.
Figure 2 indicates that taxpayers want some minimal level research and education, but after this point are unwilling to trade the benefits and services provided by farm support for additional research and education. Conversely, there is a higher degree of substitution between farm support and food assistance and between farm support and food safety.
The results reveal that most people in both information treatments were not willing to give up farm support for more food assistance. With (without) information, at the median, people were only willing to give up 0.55 (0.36) units of farm support to get one additional unit of food assistance. Of course, part of this finding is a result of the fact that the USDA currently allocates a large percentage of its budget to food assistance, and at the median, our respondents would be more satisfied with a reallocation toward more farm support.
By contrast, the results also imply that most respondents were willing to sacrifice farm support to have more food safety and inspection. With (without) information, most respondents were willing to give up 7.02 (11.69) units of farm support to get one additional unit of food safety and inspection. As for the relationship between farm support and the other budget categories, the median estimates indicate people in both information treatments were generally willing to give up farm support to have more of the benefits/services provided by expenditures on natural resources and environment, research and education, and rural development. In each of these cases, the willingness to substitute for those people without additional information was higher than for those with information. After food safety and inspection, participants were most willing to give up farm support—3.71 and 7.42 with and without information, respectively—to obtain more research and education.
Divergent desires of special interests will probably always result in debates on the appropriate allocation of USDA funds. Farm lobbyists will want to see more monies go to farm support programs, environmentalists to conservation programs, others to food assistance, and so on. Unfortunately, special interests are special; none speak for the large but un-special group, the average taxpayer. While special interest groups may ultimately have a greater impact on the outcomes of farm policy and dollar allocation, it does not make the preferences of taxpayers unimportant. This paper sought to learn more about taxpayers, namely, how they would prefer to allocate USDA funds and their willingness to reallocate funds between budget categories.
Our results show taxpayers would make some changes based on the 2008 USDA budget allocation. While that budget distributes the most money to food assistance programs, over 50% of respondents believe food safety and inspection is the most important budget category. This result is further supported by respondents’ average allocation of funds. On average, respondents were willing to allocate $24.72 and $30.07 to food safety and inspection—with and without information, respectively—both of which are substantially larger than the 2008 level of funding at approximately $3.00. Compare this to the preferred and actual allocations for food assistance—$28.43 and $20.54 allocated by respondents with and without information, respectively—vs. $60.40 allocated by the 2008 USDA budget, and we can infer people are willing to trade some food assistance dollars to gain dollars for food safety and inspection.
Looking at an overall distribution of funds, we can see people prefer a more equal allocation of dollars. On average, respondents would like to see more dollars going to food safety and inspection, natural resources and environment, research and education, and rural development and less dollars going to food assistance and farm support compared to the 2008 USDA budget. We are not suggesting these two categories, food assistance and farm support, are unimportant to people since both were still in the top three categories receiving funds in each of the information treatments; rather, we are suggesting the relative importance of the other categories to taxpayers may be greater than what is portrayed by the current allocation of funds. It is also important to note our research was conducted in 2009, so preferences for different budget categories may have changed given the continuing economic recession.
One interesting result is the trade–off people were willing to make between farm support and research and education. After food safety and inspection, research and education gained a high level of support; respondents with (without) information were willing to give up 3.71 (7.42) units of farm support to procure an additional unit of research and education. This is especially interesting result in light of the research on the inefficiencies of farm support programs as an income transfer mechanism. For example, Alston (2009) suggests it would be more efficient to invest USDA dollars in research as opposed to farm subsidies because every dollar invested in research generates $10 additional dollars for farmers whereas only $0.50 of every dollar invested in farm subsidies actually reaches the farmer. Based on these estimates, taxpayers who want to support farmers may be more inclined to shift their dollars away from farm support programs and toward research. Our results lend support to this possibility as respondents were willing to give up multiple units of farm support to gain one unit of research and education.
Additional information on the survey results and analytical techniques used to analyze the data can be obtained from the authors.
Alston, J.M. (2009). Efficiency of income transfers to farmers through public agricultural research: Theory and evidence from the United States. American Journal of Agricultural Economics 91(5):1281-1288.
Ellison, B.D., Lusk, J.L., and Briggeman, B.C. (2010). Taxpayer beliefs about farm income and preferences for farm policy. Applied Economic Perspectives & Policy. 32(2):338-354.
Greenstein, R., and Rosenbaum, D. (2007, March 12). Do budget data show that the food stamp program has been treated more favorably than farm programs in recent years? Center on Budget and Policy Priorities, Washington, D.C. Available online: http://www.cbpp.org/files/3-12-07fa.pdf.
Mankiw, G. (2009). Principles of Economics. 5th edition. Mason, OH: South-Western College Publications.
Office of Management and Budget (OMB). (2009). Budget of the United States government: Fiscal year 2010. U.S. Government Printing Office, Washington, D.C. Available online: http://www.gpoaccess.gov/usbudget/fy10/browse.html.
Pollan, M. (2008, October 12). Farmer in chief. New York Times. Available online: http://www.nytimes.com/2008/10/12/magazine/12policy-t.html.

